Curated OER
Acid-Base Titration
Students determine the concentration of an unknown solution. This task assesses students' abilities to state hypothesis, develop procedures for investigation, plan for recording and organizing observations and data, collect data, create...
Curated OER
Rubber Band
Eighth graders investigate what would happen to the length of a rubber band as more and more rings were hung on it. They base their explanation on what they observed, and as they develop cognitive skills, they should be able to...
Curated OER
Making Connections
Eighth graders investigate the input/output model for building function tables. From the data, 8th graders connect tables, graphs, function rules, and equations in one variable. They work backwards to determine function rules for given...
Curated OER
ou are the Researcher!
Students conduct a census at school. They collect data, tally it, and create a frequency table. Students display their data in three different types of graphs. They write complete sentences describing the graph.
Curated OER
Radioactive Decay
Students generate a radioactive decay table for an imaginary element, use their data to plot a decay graph, develop the concept of half-life, and use the graph to "age" several samples.
Curated OER
Reading Graphs
Students plot functions on the Cartesian coordinate plane. They explore lines and parabolas. Students analyze graphs and answer questions about the information presented on the graph using an online program.
Curated OER
An Immigration Graph
Students practice reading and understanding information in a table and converting the information to graph form. They create a graph showing the number of immigrants per country of origin between 1899 and 1924.
Curated OER
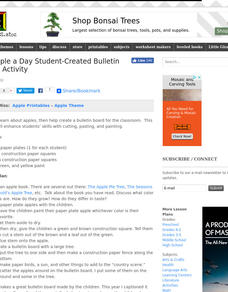
An Apple a Day
Students study apples and then paint apples whichever color is their favorite apple color. They help create a bulletin board for the classroom. They graph the different colors of apples found on the board.
Curated OER
A Cylinder Workshop
Students work with given formulas to solve for specific variables. The calculation of the volume of a cylinder and the change in volume when there is a constant surface area is analyzed in this lesson.
Curated OER
Christmas Presents
Seventh graders create a graph of their Christmas gifts. They develop categories, compute fractional and decimal parts for each category, identify the number of degrees to represent each fractional part, and create a circle graph to...
Curated OER
Jump and Graph
Third graders practice measuring skills by jumping and measuring the lengths with yardsticks. After measuring five jumps each, they draw bar graphs representing their jumps.
Curated OER
Weather through the Seasons
Students examine the year's cycles by observing the four seasons, their distinctive weather patterns that affect our activities and the weather changes that each brings. The fourteen lessons of this unit offer a good opportunity for the...
Curated OER
"Show Me" Missouri's Temperatures
Fourth graders gather climate data about cities from each of Missouri's five geographical regions and use technological tools to translate this data into graphs for further analysis and reflection.
Curated OER
Volcano Spreadsheet and Graph
Fourth graders use data from volcanoes to organize a spreadsheet and make a graph.
Curated OER
Valentine Candy Count
Students investigate what color Valentine Candy is found more often than any other in a standard bag of "Valentine Conversation Hearts." They sort, classify and graph their findings.
Curated OER
Graphs and Spreadsheets
Students collect data and present it in a graph and/or a spreadsheet, depending on their previous understanding of technology.
Curated OER
Dealing With Data
Learners collect, organize, and display data using a bar graph, line graph, pie graph, or picture graph. They write a summary describing the data represented and compare the graph to another graph in the class.
Curated OER
Smoking: The Real Cost
Third graders discuss the adverse effects of smoking and predict the financial cost of a smoking habit. They collect data regarding the cost of a pack of cigarettes and average packs smoked a day. They create bar graphs displaying the...
Curated OER
Survey Surfing
Students survey other students and record the information on a chart using tally marks. They record their favorite fish and their favorite foods, and share the results with the class.
Curated OER
Rules and Laws of the Community
Second graders recognize and identify the need for rules in school. They also discuss the importance of safety rules at school, home, and in the community. They illustrate a rule which they have learned in class, and write letters to the...
Curated OER
Introduction to Descriptive Statistics with Mode, Median, Mean and Range
Students complete several games and experiments, tally and graph their results. They figure the mean, median, range and/or average of their graphs to describe class results. They consider which statistic best represents the data at hand.
Curated OER
Reading Graphs
Students practice plotting functions on the Cartesian coordinate plane, see several categories of functions, including lines and parabolas, and read a graph, answering questions about the situation described by the graph
Curated OER
Ratios
Fourth graders complete a taste test of different sandwiches, rate them, and then put them in a ratio graph. In this ratio lesson plan, 4th graders write what they learned about ratios after this activity.
Curated OER
Graphing Practice
Students study the ways to graph values. In this graphing lesson students read graphs and use a rubric to decide how well each is constructed


