Curated OER
How Do You Spend Your Time?
Pupils keep records and determine how much time they spend on certain activities. They insert the data into a spreadsheet. Students graphically display data in a bar graph and a circle graph.
Curated OER
Reaching New Heights
Learners explore the relationship between two variables. Students measure their arm span and height. They gather this class data to design a scatter plot. Learners interpret the meaning of individual coordinates and the overall graph....
Curated OER
Studying Fossils
High schoolers hypothesize dinosaur size and speed by looking at dinosaur track way or by measuring a dinosaur models water displacement. In addition, techniques to help students become familiar with the ways paleontologists study...
Curated OER
And Around We Go!
Sixth graders conduct a survey and collect data to construct a bar graph that will then be changed into a circle graph. With the bar graph, 6th graders compare estimated fractions and percentages and estimate percentages. With the circle...
Curated OER
Voter Turnout
Students solve problems using math. They complete a graph, using data from the 2000 presidential election results. Students predict and calculate the outcome of the election based upon the voting patterns.
Curated OER
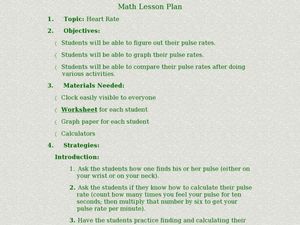
Graphing Heart Rates
Students explore heart rates. They record pulse rates, predict which exercises cause a faster heart rate, make a chart, and graph the results. Students write an essay using the data to support their predictions. They write a hypothesis...
Curated OER
Volcano Spreadsheet and Graph
Fourth graders find the height of selected volcanoes and convert their measurements to feet. Students interpret information from a graph. They also write math questions that require the use of a class created graph. Students use a...
Curated OER
Ladybugs in the Garden
Fifth graders estimate the size a population (ecosystems) Students make a chart from information collected then create a graph (line or bar) from this information. Students do a activity where they observed, examine, and record data...
Curated OER
Graphing a Healthy Lifestyle
Fifth graders, over a week, record the amount of time they spend sleeping, attending school, watching T.V., exercising and doing homework. At the end of the week the students graph all of their information and discuss how sleep impacts...
Curated OER
Parabola (Lab Version)
Students develop definition for parabola, explain relationship between properties of the graph of a parabola and its equation, explain how the equation of a parabola can be written in different forms, and solve problems that relate the...
Curated OER
Weather Plots
Students investigate the relationship between temperature and humidity. The graphs of weather data gathered and plotted for for an assigned period of time are analyzed and the interpretations shared with the class.
Curated OER
Displaying the Data
Students gather facts about their parent's families through the completion of parent interview forms. Using tally marks, the data gathered is counted, transferred to graphs and used to create family timelines.
Curated OER
Mathematics: Best Salary
Sixth graders pretend to need jobs to earn money for a go-cart which costs $1,000. They predict which of two scenarios raise the money first. they construct charts and graphs to demonstrate their predictions.
Curated OER
Smile Metric Style
Students measure the length of student smiles and then record, order and graph their results.
Curated OER
Driving Forces Forestry In Canada
Students discuss the natural and economic impact of forests and forestry. Using given statistics they construct different types of graphs in which they make observations and draw conclusions.
Curated OER
Graphing Favorite Colors
Third graders collect data and insert it into ClarisWorks to create a spreadsheet/graph of their favorite color. They interpret the data together.
Curated OER
Record 'The' Results
Third graders predict how many times they'll see the word "the" in a newspaper page and highlight all the "the"s they find. After reviewing definitions of range, median, mode, mean they create a Stem and Leaf Plot and a Back-to-Back Stem...
Curated OER
On Our Way to School
First graders create a class graph that illustrates how they get to school and interpret data from the graph. They complete an assessment worksheet independently and answer questions about the graph shown.


