CK-12 Foundation
Ck 12: Statistics: Double Bar Graphs Grade 6
[Free Registration/Login may be required to access all resource tools.] Create double bar graphs to display and compare given data.
CK-12 Foundation
Ck 12: Statistics: Multiple Bar Graphs Grades 6 7
[Free Registration/Login may be required to access all resource tools.] Create multiple bar graphs to display and compare given data.
CK-12 Foundation
Ck 12: Statistics: Multiple Bar Graphs Grade 7
[Free Registration/Login may be required to access all resource tools.] Make multiple bar graphs to display and compare data.
Math Is Fun
Math Is Fun: Data Graphs
Create and customize a bar graph, line graph, or pie chart based on a set of data and print it out.
That Quiz
That Quiz
ThatQuiz is an excellent assessment tool for teachers and students. At this site, teachers can create individualized or group assessments on a variety of math topics. Students take these practice assessments directly online and receive...
Khan Academy
Khan Academy: Make Bar Graphs 1
Practice creating bar graphs (bar charts) from data sets. Students receive immediate feedback and have the opportunity to try questions repeatedly, watch a video or receive hints.
Sophia Learning
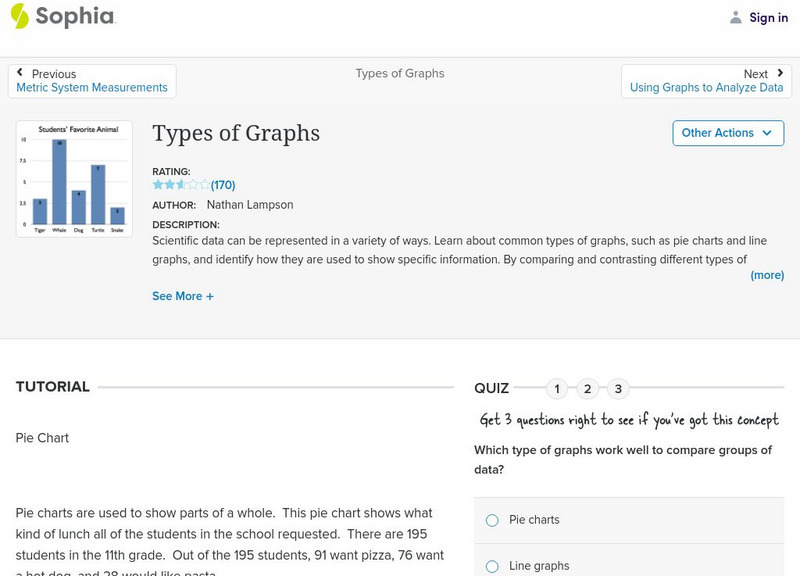
Sophia: Types of Graphs
This presentation allows the learner to visualize the different types of graphs used to display data in scientific investigations.
CK-12 Foundation
Ck 12: Statistics: Double Bar Graphs Grades 9 10
[Free Registration/Login may be required to access all resource tools.] Covers double bar graphs.
Colorado State University
Colorado State Writing Center: Charts
The use of charts and graphs can improve your presentations, whether on paper or as visual aids. Here you can read about how to create line, column, bar, pie graphs, and scatterplots. Just follow the links to their respective pages.
National Council of Teachers of Mathematics
Nctm: Figure This: Census
Try this real world challenge that focuses on data collection, data analysis, and problem solving with information from the U.S. Census Bureau. Discover how these skills are applied in real life situations in this one page activity from...
Texas Instruments
Texas Instruments: Describing Categorical Data Advanced Placement
Students categorize data using tables and bar charts. They also determine relative frequencies.
CK-12 Foundation
Ck 12: Statistics: Planning and Conducting Surveys
[Free Registration/Login may be required to access all resource tools.] Design and conduct surveys and analyze and interpret the results.
Education Development Center
Tune in to Learning: Reading Charts and Graphs
Practice graph reading skills with these exercises and companion tutorials.
Khan Academy
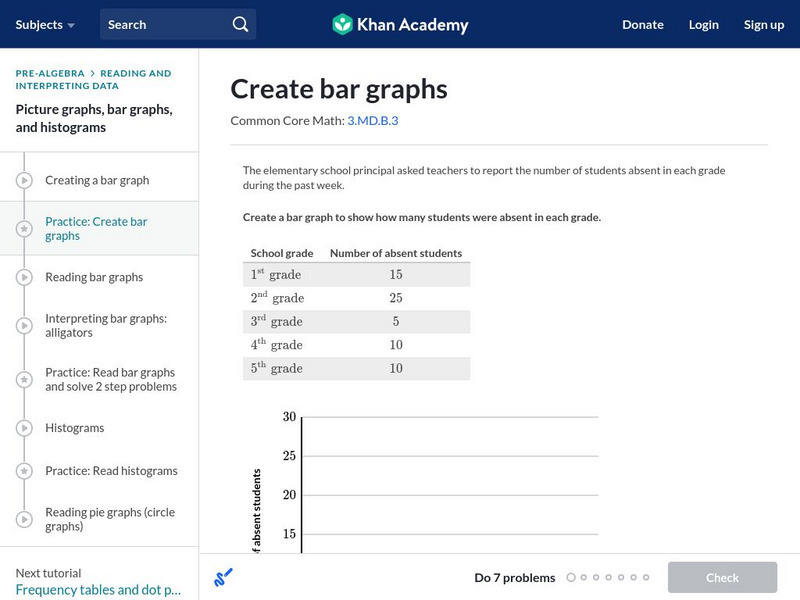
Khan Academy: Create Bar Graphs
Create a bar graph with the data given. Students receive immediate feedback and have the opportunity to try questions repeatedly, watch a video tutorial, or receive hints about creating bar graphs. CCSS.Math.Content.3.MD.B.3 Draw a...
Khan Academy
Khan Academy: Make Bar Graphs 1
A practice quiz where students construct bar graphs using the given information. Includes hints.
Khan Academy
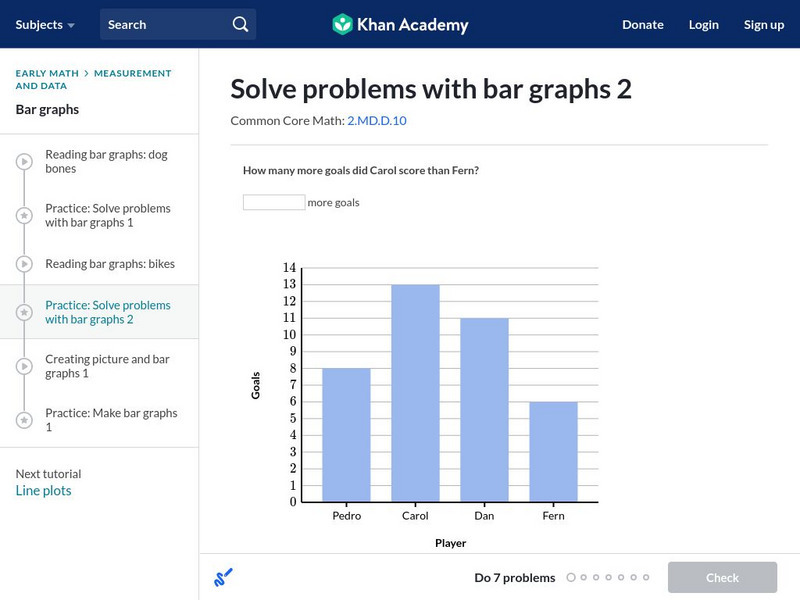
Khan Academy: Solve Problems With Bar Graphs 2
Use bar graphs to solve addition and subtraction word problems. Students receive immediate feedback and have the opportunity to try questions repeatedly, watch a tutorial video, or receive hints.
Success Link
Success Link: Fruit Loops Graphs
A lesson plan on graphing for young students that can be adapted for older elementary students too. Use Fruit Loops for providing data that can be expressed in many different graphs.
Illustrative Mathematics
Illustrative Mathematics: Favorite Ice Cream Flavor
The purpose of this task is for students to represent and interpret categorical data. As a class, students will answer a question with three possible answers and construct a bar graph with the responses. Multiple discussion questions and...
Illustrative Mathematics
Illustrative Mathematics: 8.sp.4 Music and Sports
This task looks at a possible relationship between playing a sport and playing a musical instrument. Students collect data from classmates, summarize the data into a two-way table, make some observations, and construct a bar graph of the...
Khan Academy
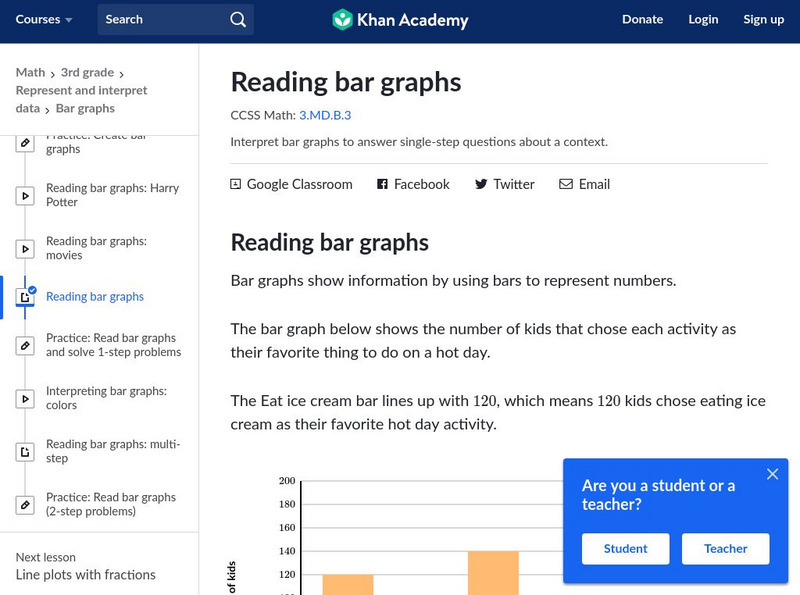
Khan Academy: Reading Bar Graphs
Explains what bar graphs are, their uses, and presents practice problems for creating a bar graph and answering questions about them. Problems are accompanied by detailed solutions.
ArtsNow
Arts Now Learning: We Are Living Graphs and Data [Pdf]
In this lesson, 3rd graders use their own bodies to create bar graphs and do problems involving addition, subtraction, and more or less amounts. They then create their own graphs, incorporating the features of graphs that they have...
CK-12 Foundation
Ck 12: Physical Science: Scientific Graphing
[Free Registration/Login may be required to access all resource tools.] Usefulness and types of graphs.
Rice University
Rice University: Cynthia Lanius: Let's Graph
An introduction to bar graphs, both vertical and horizontal in nature. The interactive aspect of this site allows students to change the values of the data - their favorite cafeteria foods - and then see how the graph is changed.
US Department of Education
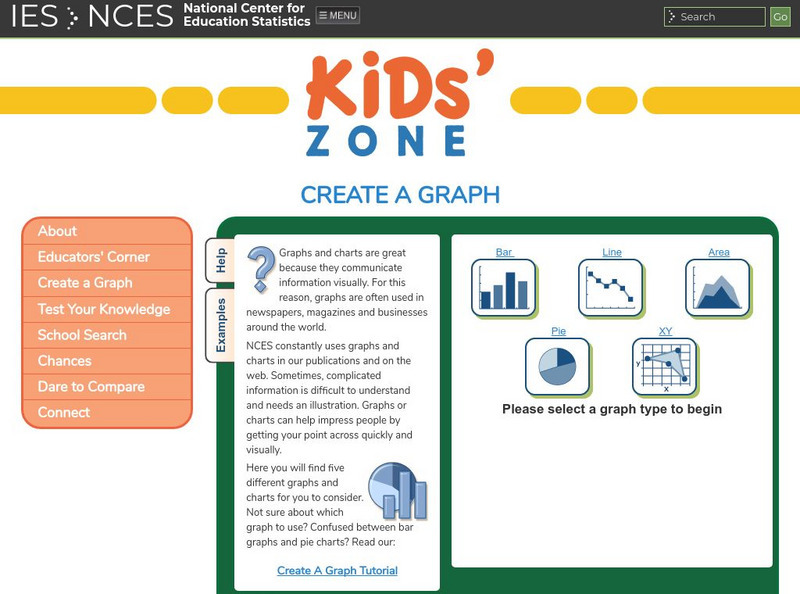
Nces's Create a Graph: Bar Graph
This site from the National Center for Education Statistics allows you to create great bar graphs! Simply enter your information, choose appropriate colors, and voila! -- you have a beautiful graph you can turn put into your report!









![Arts Now Learning: We Are Living Graphs and Data [Pdf] Lesson Plan Arts Now Learning: We Are Living Graphs and Data [Pdf] Lesson Plan](https://static.lp.lexp.cloud/images/attachment_defaults/resource/large/FPO-knovation.png)


