Curated OER
Graphing Pasta
Students sort and graph various types of pasta. Using pasta construction paper patterns or real pasta, they sort the pasta by color, size, and type, and record the data on a graph.
Curated OER
Surveys and Graphing
First graders survey different classrooms to determine types of products students would like to see sold at school, and create graphs based on survey results.
Curated OER
Green Food Graph
Students explore graph making by investigating St. Patrick's day food. In this holiday food lesson, students discuss their favorite green foods in honor of St. Patrick's day. Students create a graph based on the data of which green foods...
Curated OER
Math Snack
Students practice math skills as they sort treats for snack. They prepare a table for snack. They count snack items. They complete a graph using the counted items.
Curated OER
Math! What's It All About?
Students explore what it means to solve problems and communicate in real life situations. They recognize math in a variety of real life materials. Also, they determine what procedures they use to solve a problem and what areas of math...
Curated OER
Graph Groups (One Color)
In this graphing worksheet, students solve 5 problems in which the colored shapes in each set are counted. Students then fill out a bar graph to show how many of each color are in the sets.
Curated OER
What Does Your Bean Seed Look Like Today?-- Class Bar Graph
For this math/science worksheet, learners who are already beginning to grow a bean seed record what it looks like on a given day. Detailed pictures of different growth stages are provided on the class graph.
Curated OER
Do You Like Cold Or Hot Lunch Better?: Graph
In this bar graph worksheet, students will ask classmates if they prefer hot or cold lunch and record answers to complete the graph.
Curated OER
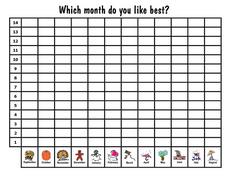
Which Month Do You Like the Best?: Graph
In this favorite month graph, students will ask their classmates which month is their favorite and record the responses to complete the bar graph.
Curated OER
How Tall Are You?: Graph
In this height bar graph worksheet, students will ask their classmates how tall they are and record the responses to complete the graph.
Curated OER
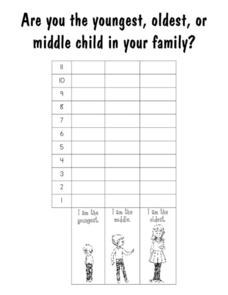
Are You the Youngest, Oldest Or Middle Child?: Graph
In this family order graph worksheet, students will ask their classmates if they are the youngest, oldest, or middle child in their family and record the responses to complete the graph.
Curated OER
Do You Like To Color With Crayons, Markers, Or Colored Pencils?: Graph
In this bar graph worksheet, students will ask classmates what they like to use when coloring: crayons, markers or colored pencils? Then students will record the responses to complete the bar graph.
Curated OER
Which Places Have You Visited?: Graph
In this bar graph worksheet, students will ask their classmates which places they have visited before and record responses to complete the graph. There are 6 generic places from which to choose.
Curated OER
Do You Like Breakfast, Lunch, Or Dinner Best?: Graph
In this favorite meal bar graph worksheet, students will ask their classmates which meal they prefer and then record responses to complete the graph.
Curated OER
What is Your Favorite Christmas Light Color? Bar Graph Recording Sheet
In this opinion bar graph worksheet, students receive a number and record their preference of Christmas light color in the worksheet. They examine the colored boxes at the bottom of the page to make their choice. There are no directions...
Curated OER
Graphing Conversation Hearts
Students collect data and create a graph. In this mathematics lesson, students separate paper hearts by color and create a graph showing the number of hearts of each color present. Students receive a handful of candy hearts that...
Curated OER
Sorting and Graphing Animals
Students inquire about animals using SIRS Discoverer or eLibrary Elementary. In this organizing data lesson, students sort pictures of animals in various ways and develop graphs. Students locate a mammal, reptile, fish, insect or...
Curated OER
RCX Car Line Graph
Students develop a line graph based on distances that an RCX car drives in specified amounts of time. They then are given a specific amount of time for the car to drive and be asked to extrapolate the car's distance from the graph.
Curated OER
Counting And Graphing
Students explore counting and graphing. In this math lesson plan, students practice counting from 1-25 and are exposed to two types of graphs: the pie graph and the bar graph. Students use Skittles to represent a variety of measurements.
Curated OER
Graphing in the Form of Bar Graphs
Students explore bar graphs. In this math lesson, students create and conduct a survey. Students graph their data in a bar graph.
Curated OER
Picture Graphs
First graders work with picture graphs, create their own individual graphs, and construct and read graphs.
Curated OER
Study Buddies - Bar Graphs
In this data collection worksheet, pupils work with a partner to make 3 small bar graphs after finding the proper number of circles on the first page. They look at a page of a variety of shapes and separate the circles into black, gray,...
Curated OER
Graphing Trash Material
Students investigate data and recyclable materials. In this math lesson, students save recyclable materials and create a graph of the materials. Students discuss how they could help the environment by recycling.
Other popular searches
- Charts and Graphs Math
- Hidden Picture Math Graphs
- Misleading Graphs Math
- Powerpoint Math Graphs
- 1st Grade Math Graphs
- Math Graphs 4th Grade
- Math Reading Graphs
- Animals Math Graphs
- Math Graphs Grade 1
- Creating Math Graphs
- Math Graphs Using M&ms
- Math Interpreting Graphs


