Curated OER
A Line Graph of the Ocean Floor
Learners develop a spreadsheet and import the information into a line graph. In this spreadsheet and line graph instructional activity, students develop a spreadsheet of ocean depths. They import the information into a word processed...
Curated OER
Picture This: Election Results Graphs
Students use art supplies or a free online tool to graph election results. Students follow local election and results. Using "Create a Graph, a free online graphing tool, they make a graph of the results.
Math Drills
Thanksgiving Cartesian Art: Pilgrim Hat
What did some Pilgrims wear on top of their heads? Individuals graph sets of ordered pairs, and connect the points to create a mystery Thanksgiving picture.
Curated OER
A Picture's Worth 1000 Words: Decoding Intercultural Symbols
Pupils interpret a set of pictographs, defining what each image means and create their own set of symbols as an alphabet. They then write using their own symbolic alphabet using pictures.
Curated OER
Graphing Regions: Lesson 2
Young scholars identify and analyze geographical locations of inventors. They each identify where their inventor is from on a U.S. map, discuss geographic patterns, and create a t-chart and graph using the Graph Club 2.0 Software.
Syracuse University
Erie Canal
While canals are not the way to travel today, in the first half of the nineteenth century, they were sometimes the best way to move goods and people. Scholars examine primary sources, including maps and pictures, to investigate the role...
Curated OER
A Thanksgiving Survey
Students take a survey then use the information gained from the survey to help plan a typical Thanksgiving dinner for our last day of class. They create a graph which corresponds the the data gathered during interviews.
Living Rainforest
Finding the Rainforests
From Brazil to Indonesia, young scientists investigate the geography and climate of the world's tropical rain forests with this collection of worksheets.
Curated OER
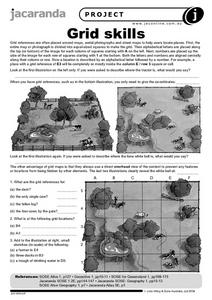
Grid Skills
In this geography worksheet, students use grid references on a map to locate places in the pictures given. They also identify another advantage of using a grid map, which they have an overhead view of the content to prevent any features...
Super Duper Publications
Difficult Situations Fun Deck
What would you do? Fifty-six illustrated picture flash cards provide players with an opportunity to talk about difficult situations, practice responses to awkward or uncomfortable situations, and consider how to deal with dangerous...
Curated OER
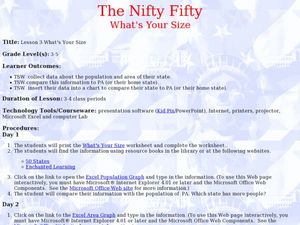
The Nifty Fifty-What's Your Size?
Young scholars explore state populations. In this state geography lesson, students use a variety of technology tools to research and graph population and area of assigned states.
Curated OER
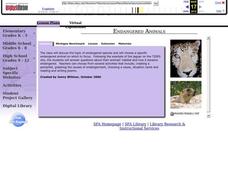
Endangered Animals
Students listen to a teacher led lecture on jaguars, their habitats, and how they became endangered. Using a specified web site, they choose an endangered animal to research. After gathering information, students participate in...
Curated OER
Tell a Totem Story
Students study and view pictures of Native American totem poles on the internet. They create totem poles using PowerPoint that represent their family histories using symbols to designate historic events.
Curated OER
Changes In Change
Learners research the changes in change over time. Students choose one coin to research and trace in history. Learners graph out a time line on their coins. Students present their time lines to the class.
Curated OER
Traveling Through Time, Wetland Style
Students create a timeline on the development of the Pajaro Valley Area. In this social science lesson, students discuss the changes that took place in the area over the past 300 years. They draw a pictures of how the area has changed...
Curated OER
Why do people mover where they do?
Young scholars read factual stories of migration to Hawaii, analyze and explain push and pull factors, interview parents about their cultural heritage, identify countried of origin of their ancestors, graph migration patterns on an world...
Curated OER
Voting and Elections: Vote to Make a Difference
Students use a ballot to make a choice about two items to vote on. For this voting lesson plan, students discuss comparing choices between two items, the benefits and drawbacks to each, and make tally marks to total the votes.
Curated OER
Groups Coming to America
Fifth graders use text or other references to locate different types of information about the Mayflower and pilgrims. They create a presentation for lower elementary classes about the Pilgrims.
Curated OER
Picture a Nation
Students research immigration data from a specific time period. They create a graphic organizer that depicts the information and share the information with the class.
Curated OER
Class Time Capsule
Students record and graph information about themselves and the class. They put the information in a time capsule that they reopen at the end of the year.
Curated OER
Where In the World Are We?
Fifth graders read postcards and find their locations on maps. They use the pictures and text on the postcards to write about imaginary vacations. They compute the mileage and compare it to TripMaker data.
Curated OER
Family Roles
Students describe possible solutions to problems in the family. They fill out a family graph of their real family. students create a book of their made up family.
Curated OER
Nonprofits Are Necessaary
Students research community nonprofit organizations. They identify their purposes and graph them. The search telephone books, websites, and magazines for information on local organizations. They write in journals how nonprofit groups...
Curated OER
Indian Resistance
Students observe the pictures and maps of the Sequoyah Indians. In this Sequoyah lesson plan, students use the maps and pictures to discuss observations and write responses of the Indian point of view.
Other popular searches
- Coordinate Picture Graphs
- Christmas Picture Graphs
- M&m Picture Graphs
- Hidden Picture Math Graphs
- Picture Graphs Worksheets
- Math Lessons Picture Graphs
- 5th Grade Picture Graphs
- Bar and Picture Graphs
- Thanksgiving Picture Graphs
- Circle and Picture Graphs
- Picture Graphs Template
- Reading Picture Graphs


