Curated OER
Calculating & Graphing Using a Spreadsheet
Students use the lab apparatus to calculate the average velocity and average acceleration at several points and record the data. They use the spreadsheets to plot distance vs. time, velocity vs. time and acceleration vs. time graphs.
Curated OER
Make Your Own "Weather" Map
Pupils create their own "weather" map using data from x-ray sources. They analyze and discuss why it is important to organize data in a fashion in which is easy to read. They compare and contrast different x-ray sources using a stellar map.
Curated OER
Glow With the Flow
High schoolers investigate the force of drag and how NASA engineers use models and glowing paints to examine how air flows over vehicles in a wind tunnel. They discover how the blended wing body will affect air travelers of the future.
Curated OER
Bubble Gum Chemistry
Students explore the concept of graphing data. In this graphing data lesson, students determine the percentage of sugar in bubble gum. Students graph type of gum vs. sugar percentage. Students create a table of their data.
Alabama Learning Exchange
The Composition of Seawater
Students explore the concept of finding the composition of seawater. In this finding the composition of seawater instructional activity, students make a saturated salt water solution. Students discuss why there is variation in ocean...
Curated OER
How BIG is 400?
Students solve problems using dimensional analysis. In this chemistry lesson plan, students choose a problem and present it in class. The rest of the class will evaluate the solved problem on the board.
Curated OER
Lift/Velocity Relationship Problem Set
Students, after reading an explanation from a NASA Web-based textbook, demonstrate their ability to use, graph (using a graphing calculator), and interpret a text equation.
Curated OER
The Lift Equation Problem Set
Students, after reading the Lift Equation page from a NASA Web-based textbook, demonstrate an understanding of the lift equation by answering questions.
Curated OER
Aircraft Trajectory Problem Set
Students, after reading an explanation from a NASA Web-based textbook, demonstrate an understanding of the text by applying it to the calculation of speed, distance, acceleration, and time in simple aircraft motion.
Curated OER
Wind Tunnel Aerodynamics Problem Set
Students, after reading an explanation from a NASA Web-based textbook, demonstrate an understanding of the text by applying it to the calculation of area, velocity, and pressure in a wind tunnel.
Curated OER
Drag Equation - Level 1
Young scholars, after reading the Drag Equation page from the NASA Web site, demonstrate an understanding of this equation and how drag is dependent on the variables included in the equation.
Curated OER
Drag Equation - Level 2
Students, after reading the Drag Equation page from the NASA Web-based textbook, demonstrate an understanding of this equation and how drag is dependent on the variables included in the equation.
Curated OER
Thrust to Weight Ratio and Excess Thrust
Students, after reading an explanation from a NASA Web site, demonstrate an understanding of the text by applying it to questions involving the Thrust to Weight Ratio and Excess Thrust of an aircraft.
Curated OER
Lift Equation Problem Set
High schoolers, after reading an explanation from a NASA Web-based textbook, demonstrate an understanding of the text by using it, along with FoilSim, to complete an activity to graph and interpret the lift equation.
Curated OER
From Molecules to Mole Day Do's
Students recognize methods used to define the mole. After converting various quantities to the mole, students provide a context for understanding the usefulness of scientific notation and the mole.
Curated OER
One Square Foot
Students identify, describe, count, tally, and graph life found in one square foot of land.
Curated OER
Pumps
Students examine the basic types of pumps. They build a gravity-driven water pump and solve a mystery using their knowledge of pressures and pumps.
Curated OER
Circle the Earth - Explore Surface Types on a Journey around Earth
Students use CERES percent coverage surface data with a world map in locating landmasses and bodies of water at Earth's Equator.
Curated OER
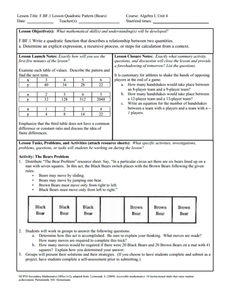
How Many Bears in the Forest?
Third graders model the tag and recapture of bears and use proportions to estimate the population of the bears in their forest. This is a statistical sampling method used by scientists and naturalists to determine population numbers.
Curated OER
Your Body's Building Blocks
Students study the elements of the Periodic Table as they relate to the building blocks of the body. They experiment to measure the amount of iron in the body.
Curated OER
Bears
Pupils complete a variety of bear-related activities. They sort and graph teddy bears, distinguish between real and non-real bears and research bear life cycles and habitats.
Curated OER
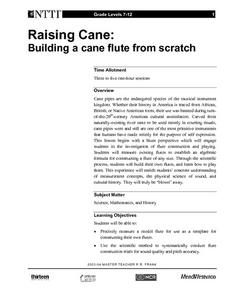
Raising Cane: Building a Cane Flute From Scratch
Eighth graders create their own cane flute. They use a model flute to gain the correct measurements and use the scientific method to construct the flute to have sound quality and pitch accuracy.
Curated OER
Flow Rates of Faucets and Rivers
Students work together to discover the flow rates of faucets and rivers. They relate their results to engineering and applied science concepts. They make predictions on the flow rate of a nearby river in their local community.
Curated OER
Investigating Motion
Students determine velocity using the slope of a time distance graph. They investigate a motion cart using a CBR unit and a TI 83 calculator setup. Using the graph generated, they calculate velocity.
Other popular searches
- Algebraic Expressions
- Pre Algebra
- Algebra Equations Worksheets
- Algebra Equations
- Algebra Worksheets
- Algebra Tiles
- Algebra 2
- Algebra 1
- Algebra Games
- Algebra Projects
- Beginning Algebra
- Algebra 1 Powerpoint


