Chicago Botanic Garden
Are You Bigfoot?
Scholars independently explore several websites to calculate their ecological footprint. Using their new found knowledge, they answer six short-answer questions and take part in a grand conversation with their peers about how...
Curated OER
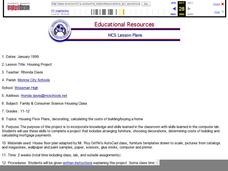
Housing Project
Find everything you need for a two-week home construction simulation project for your high school economics class. They come up with the plans for a custom home including the cost per square foot, interest rate, mortgage term, down...
Curated OER
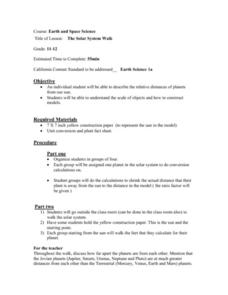
The Solar System Walk
A unique lesson on the solar system, and some of the mathematics associated with it, is here for your high schoolers. Pupils are put into groups of four, and each group is assigned one of the planets from our solar system. They must...
Curated OER
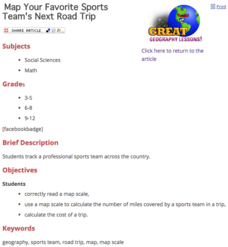
Map Your Favorite Sports Team's Next Road Trip
Students track a sports team across the country. They use a map scale to calculate the number of miles traveled by their sports team on a trip, conduct Internet research, and calculate how much it would cost them to go along on the trip.
Curated OER
THAT'S WHY THEY CALL IT SPACE
Ninth graders set up a scale model of the solar system using the same scale for distance and diameter. They calculate scale distances and sizes for modeling the solar system and relate actual distances to difficulties in discovering and...
Curated OER
SIZING UP SOL
Ninth graders produce a projected, pinhole image of the sun and from measurement of the image and projection distance, calculate the actual size of the sun. They estimate the sun's apparent brightness from different planet.
Curated OER
Investigation Designing a Patchwork Quilt
Fourth graders practice calculating area by creating a classroom quilt. Students are given a 6x6 inch square material they design based on a classroom theme. A sample of the class quilt is created using graph paper so students may...
Curated OER
The Candy Color Caper
Learners explore the concept of probability. They calculate the probability of an event happening and graph their results. Students determine the probability of winning a sweepstakes. They construct a bar graph to represent all the...
Curated OER
How Long Can You Go?
Eighth graders examine the usefulness of a line of best fit by collecting and graphing data, using a graphing calculator to determine the line of best fit, and making a variety of predictions. They watch a video, then design a...
Curated OER
Tracking Speed
Students calculate the speed of an object, by measuring the amount of time it takes to cover a given distance, and then divide: speed=distance/time. However, the object may not have been moving at a constant rate over the given distance....
Curated OER
Scale Model of the Solar System
Young scientists gain a better understanding of space, the solar system and its vastness by creating a scale model. Students first need to calculate the distance between each of the nine planets according to the size of their scale. This...
Curated OER
Scale Drawing: Insulating Another Attic
Give your future household repair specialists a real-life chance to apply the concepts of ratio and proportion. Using a scale drawing, they calculate the missing dimensions of two walls of a compound-shaped attic. They then figure how...
Curated OER
Super Size It, Please!
Pupils take photos from a given distance and determine the height of the person using a scale factor. Pupils calculate the ratio of student actual height to student photo height. They take pictures from 3 different distances to see if...
Curated OER
Systems of Linear Equations
Introduce the inverse matrix method to solve systems of linear equations both algebraically and graphically. Using given data, your class checks their answers with graphing calculators. Handouts are included in this well-thought out lesson.
Curated OER
Lab Activity: Model of the Planets
This instructional activity leads the class through the calculations needed to construct circles to represent the planets of our Solar System. The actual values are provided, as are suggested calculations to create the scale diameters. ...
Curated OER
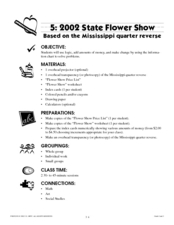
2002 State Flower Show
Here is another State Quarter instructional activity. This one uses the Mississippi State Quarter. Pupils utilize beautifully-designed worksheets embedded in the plan, to practice calculating which combinations of flowers they can afford...
Curated OER
Residential Power System
Perform data analysis on energy consumption to apply algebraic expressions to the real world. Learners will write and solve equations that answer various questions from residential power use. They will collect data at home and calculate...
Curated OER
Mathematical Modeling
Study various types of mathematical models in this math lesson. Learners calculate the slope to determine the risk in a situation described. They respond to a number of questions and analyze their statistical data. Then, they determine...
University of Wisconsin
Sizing a Rain Garden
Most appropriate if you are applying the entire unit to build a rain garden at your school, this installment involves calculating the area that will drain into it. Your garden planners will need data from previous lessons, so this one...
It's About Time
Factors Affecting Population Size
How do we predict future population growth? Young researchers investigate various factors affecting the size of our population. As they calculate and interpret graphs to determine factors that could potentially affect increases...
EngageNY
Margin of Error When Estimating a Population Mean (part 2)
Don't leave your classes vulnerable in their calculations! Help them understand the importance of calculating a margin of error to represent the variability in their sample mean.
EngageNY
Margin of Error When Estimating a Population Mean (part 1)
We know that sample data varies — it's time to quantify that variability! After calculating a sample mean, pupils calculate the margin of error. They repeat the process with a greater number of sample means and compare the results.
Noyce Foundation
Ducklings
The class gets their mean and median all in a row with an assessment task that uses a population of ducklings to work with data displays and measures of central tendency. Pupils create a frequency chart and calculate the mean and median....
Noyce Foundation
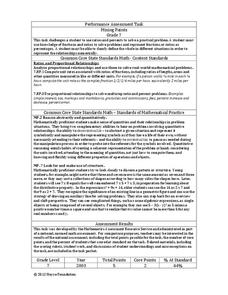
Mixing Paints
Let's paint the town equal parts yellow and violet, or simply brown. Pupils calculate the amount of blue and red paint needed to make six quarts of brown paint. Individuals then explain how they determined the percentage of the brown...
Other popular searches
- Calculator Skills
- Ti 83 Graphing Calculator
- Using a Calculator
- Calculator Activities
- Calculator Math
- Calculator Math Games
- Graphing Calculators
- Algebra Graphing Calculator
- Calculator Lessons
- Computer Calculator
- Ti Explorer Calculator
- Graphing Calculator Activity

