Curated OER
Collecting and Recording Data# O
Students observe plants growing over time, measure specific plant growth, and gather and record data on plan growth.
Curated OER
Dental Arithmetic: Sugar Clocks
Students analyze data about their teeth. In this data collection lesson plan, students determine how often their teeth should be brushed during the day. Students also estimate the amounts of sugar in 17 foods.
Curated OER
Cloud Key: Clouds
In this identifying clouds worksheet, students cut and make a cloud wheel that they then use to help them identify the cloud formations on various days. Students create a chart to record their data.
Curated OER
Determination of Phylogenetic Relationships Using Restriction Analysis
Students applied various mathematical analyses to interpret their data. By using the resulting DNA fragment patterns from several enzymes students established a possible evolutionary relationship among the mice.
Curated OER
Tale of a Tuna
Junior marine biologists access the International Commission for the Conservation of Atlantic Tunas' data on Atlantic Bluefin Tuna catches. As they analyze the data, they answer three questions. Background information and links to...
Curated OER
Iced In
Introduce junior oceanographers to ice conditions in The Great Lakes. The ice map links are no longer available, so you will not be able to have your class perform the mentioned data activity. You can, however, access the Canadian Ice...
Polar Trec
What Can We Learn from Sediments?
Varve: a deposit of cyclical sediments that help scientists determine historical climates. Individuals analyze the topography of a region and then study varve datasets from the same area. Using this information, they determine the...
Curated OER
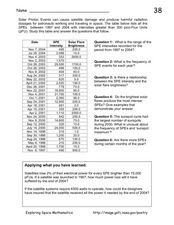
Solar Proton Events
On this worksheet, space scientists use a data table to answer questions about the relationship between the brightness of solar flares and the intensity of the solar proton events. They apply what they learned from the data to address...
Howard Hughes Medical Institute
Population Genetics, Selection, and Evolution
The Hardy-Weinberg principle states that alleles and genotypes remain constant in the absence of evolutionary influences. Scholars complete a simple hands-on activity applying the Hardy-Weinberg principle to sample data. They observe how...
Hazardous Waste Management Program
Molar Mass Determination from Freezing Point Depression
Let the data tell the story. A lab activity has pupils collect temperature data on solutes as they melt and freeze. They use their data to create a cooling curve and then calculate the molar mass using the freezing point depression.
National Institute of Environmental Health Sciences
A Student Exploration of the Global Impacts of Climate Change on Human Health
Small efforts can have global impacts. Learners use data to analyze public health impacts on climate change. They read articles that present relative data about climate change and use the data to make conclusions about the impact on...
NASA
Comparing Temperature and Solar Radiation for Common Latitudes
There's snow much to learn! Excited individuals use real-world data to discover how latitude affects the odds of a snow day. Scientists compare latitude, solar radiation, and temperature using NASA data for several locations....
Curated OER
Introduction to Graphical Representation of Data Sets in Connection to Cellular Growth
Students practice graphing relationships between variables by studying topics such as exponential growth and decay. They conduct a series of numerical experiments using a computer model and a variety of physical experiments using mold,...
Curated OER
Schools Going Solar
If your school has a photovoltaic system, you can use this lesson plan to guide learners through an investigation of the factors affecting performance. Familiarize yourself with the data acquisition system, and then provide data for your...
Curated OER
Changing Planet: Melting Glaciers
Resource links to a video, satellite images, data, and photographs of glaciers provide emerging earth scientists the opportunity to examine how the ice has been retreating over the years. A data table is included for pupils to record...
Curated OER
Adaptation Investigation - Extreme Beaks
Find photos of bird beaks or show a prepared four slide PowerPoint, "Extreme Beaks" to introduce your class to this special animal adaptation. Provide them with a data table and supplies to try gathering food with tools that each...
Curated OER
Season Worksheet #5
Sunrise, sunset, swiftly fly the years! Your earth scientists can also fly through a year of daylight data. They analyze a graph and then answer five multiple choice questions about the rising and setting of the sun, the total number of...
College at Brockport
Healthy Ecosystems
Is there a connection between the snowshoe hare population and the lynx population? Young scientists will examine this question and graph actual data to determine the relationship between these two species, as well as researching another...
It's About Time
Coal and Your Community
When I was young, I was afraid of the dark. Now I am afraid of getting the electric bill. This fourth lesson in a series of eight focuses on coal mining, conservation, and energy efficiency. Scholars start by taking data from a table and...
PBS
Light Curves of Kepler's First Five Discoveries
The Kepler missions discovered and confirmed more than 2,650 exoplanets to date. A video shares the data from the first five discoveries. It provides graphs and diagrams to put each discovery in perspective to help scholars discuss the...
Howard Hughes Medical Institute
Finding the Crater
A mass extinction event caused by an impact usually leaves a crater. Scholars use data from 10 different sites around the world trying to determine where to look for the crater. They use data, listing the amount of various minerals to...
Purdue University
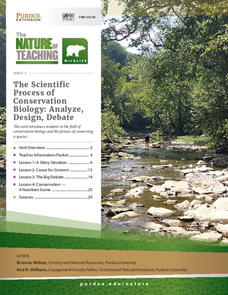
The Scientific Process of Conservation Biology: Analyze, Design, Debate
Scientists use data to learn about species survival—and your classes can too! A set of four lessons guides learners through a process to draw conclusions about the fluctuations in the population of the Hellbender species. They read...
National Institute of Environmental Health Sciences
A Student Exploration of the Impacts of Climate Change on Human Health in the United States
Let the data drive the science. Learners examine data provided in resources to discover connections between climate change and health of vulnerable populations. They study trends and present findings using their choice of projects.
PBS
House Warming
Things should heat up during a hands-on lesson exploring solar energy. An enlightening activity challenges young scientists to design a structure that collects solar energy efficiently. They keep track of temperature data over time and...
Other popular searches
- Data, Census, & Statistics
- Data Analysis Pictograph
- Data Table
- Categorical Data
- Data Analysis Lesson Plans
- Data Management
- Data Analysis Graphing
- Data Analysis and Graphs
- Science Fair Project Data
- Data Display
- Organizing Data
- Census Data


