Curated OER
Estimation
Young scholars estimate the cost of individual items found on a typical grocery list. They participte in a teacher-led demonstration, solve word problems, and estimate the cost of ten items placed into their group's grocery basket.
Curated OER
How Much Further Is It?
Fifth graders use estimation to solve problems and assess the reasonableness of their answers. They may use an odometer, a map with a legend, MapQuest, or a map without a legen. They estimate 4 to 5 different scenarios.
Curated OER
Discussing How Plants Grow
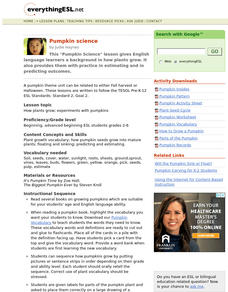
Study how plants grow with your English language learners with a cross-curricular instructional activity revolving around pumpkins. These activities provide opportunities to practice new scientific vocabulary while practicing skills such...
Curated OER
Pumpkin Carving for K-2 Students
Students carve pumpkins, draw pictures and label layers of a seed, and write steps needed to carve pumpkin.
Curated OER
Make a 100
Second graders develop an understanding of 100 and the quantity for which it stands and examine the relationship between 100 and 10 by estimating the number of jelly beans in a jar.
Curated OER
Real-World Reasonableness
Fifth graders apply math to real-world situations. In this mathematics lesson, 5th graders are read the book, "Math Curse," which discusses ways in which math is used each day. Students then write a sequel to the book in groups,...
Curated OER
The Yo-Yo Problem: Solving Linear Equations
Students compute the length of time it will take to save enough money to purchase a yo-yo. In this math activity, students create a design with pennies and write the associated linear equation. In this linear equations activity, students...
Curated OER
Table Interpretation
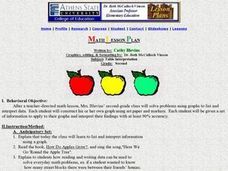
Students solve problems using graphs to list and interpret data. Each student construct his or her own graph using art paper and markers. They be given a set of information to apply to their graphs and interpret their findings.
Other popular searches
- Estimations
- Front End Estimation
- Rounding and Estimation
- Front End Estimation
- Estimation Strategies
- Estimation Multiplication
- Estimation Math
- Estimating Products
- Estimation Decimals
- Computation and Estimation
- Measurement and Estimation
- Estimation Techniques


