Curated OER
Tables, Charts and Graphs
Learners examine a science journal to develop an understanding of graphs in science. In this data analysis lesson, students read an article from the Natural Inquirer and discuss the meaning of the included graph. Learners create a...
Curated OER
There's a World of Science to Read Today!
Students read a current science article. They write a summary of the article, take notes, write and edit a summary, and print their work.
Curated OER
What's Your Favorite Planet?
Fourth graders, after listing the nine planets and their differences, choose one planet as their favorite. From the information acquired on each students favorite planet, they make a graph illustrating their favorites and then transform...
Curated OER
Applied Science - Science and Math Lab
Students make a prediction. In this applied science lesson, students guess the number of items in a jar. Students create a bar graph to show the predictions and the actual amounts.
Curated OER
The Mind-Body Connection
Second graders learn about the human body. For this biology lesson plan, 2nd graders will begin with the basics of understanding charts and graphs and progress into units that cover the body systems, and mental and emotional health....
Curated OER
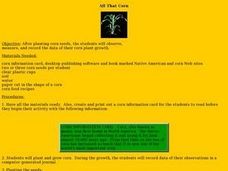
All That Corn
Students observe and record data. For this plant growth lesson, students plant and grow corn. Students observe the growth of their corn and record their data. Students read corn recipes and select their favorite four recipes to write...
Curated OER
Determining the Number of Wavelengths
After displaying three diagrams showing 1, 1 1/2, and 2 wavelengths, the slide show presents more diagrams and expects pupils to determine the number of wavelengths in each. No labels or explanations are provided, so this would be useful...
Curated OER
Graphing the Weather
Fourth graders predict the weather for their area using simple weather instruments. They take readings for a month during a season and graph their results. Students describe weather patterns based on their data and predict future weather...
Curated OER
Graphing Speed
For this graphing worksheet, students read about independent and dependant variables and learn how to determine speed from the slope of a position vs. time graph. This worksheet has 4 matching, 17 fill in the blank, and 2 problems to solve.
Curated OER
Cloudy Days are for Reading and Writing
Students research weather proverbs and determine the scientific validity of 3 weather proverbs. They write an essay presenting their reasoning. They interview elderly people to graph the most frequently heard proverbs and theorize...
Curated OER
Get a Leg Up
Traveling through space is an amazing experience, but it definitely takes a toll on the body. After reading an article and watching a brief video, learners perform an experiment that simulates the effects of zero gravity on the human body.
Curated OER
Bald Eagle Population Graphing
Students create graphs to illustrate the bald eagle population. They identify the population of bald eagles in Minnesota and the United States. They create three graphs to represent the population data including a line, bar, and...
Polar Trec
Beacon Valley Weather
In Beacon Valley, katabatic winds regularly knock fit adults to the ground. The lesson compares the actual temperatures to the wind chill after factoring in katabatic winds in Beacon Valley. Scholars learn to calculate wind chill and...
National Wildlife Federation
Hot, Hotter, Hottest: Extreme Weather's Impact on Our Resources
How dry is it? It's so dry, the river only runs twice a week! Through an analysis of maps and discussions, pairs learn about droughts across the United States in the ninth of 12 lessons. They then read about, answer questions, analyze...
University of Georgia
Freezing and Melting of Water
Examine the behavior of energy as water freezes and melts. An engaging activity provides a hands-on experience to learners. Collaborative groups collect data and analyze the graphs of the temperature of water as it freezes and then...
It's About Time
Newton's Law of Universal Gravitation
While science is looking for correct explanations, pseudoscience often fills in the blanks. Pupils explore the relationship between light distance and intensity and graph their data. Then they compare their data to Newton's Law of...
Curated OER
Science Jeopardy
Wow! Review an entire semester of biology curriculum playing this Science Jeopardy game! The variety of topics is extremely broad, so you will need to review each question to find if they all apply to your course. As you find material...
University of California
Seasons Lab Book
Unlock the mystery behind seasonal change with a collection of worksheets and activities. Whether they are drawing pictures of Earth's orbit around the sun or graphing the temperature and daylight hours of different locations from around...
It's About Time
Volcanic Hazards: Airborne Debris
Pupils interpret maps and graph data related to volcanic ash. Then they analyze the importance of wind speed and the dangers of the ash to both life, air temperature, and technology.
Curated OER
A world of oil
Students practice in analyzing spatial data in maps and graphic presentations while studying the distribution of fossil fuel resources. They study, analyze, and map the distribution of fossil fuels on blank maps. Students discuss gas...
Polar Trec
Global Snow Cover Changes
Snow is actually translucent, reflecting light off its surface which creates its white appearance. Pairs or individuals access the given website and answer questions about snow cover. They analyze graphs and charts, examine data, and...
UAF Geophysical Institute
Carbon Footprint
Your young environmentalists can calculate their carbon footprint and discuss ways to reduce it with a worksheet about climate change. After reading a handout about what impact one's carbon footprint can have on the environment, kids...
Curated OER
Don't Slip!
Pupils measure, record, and graph the force of moving a block of wood along sand paper. In this friction lesson plan, students read a spring scale, collect data, construct a graph, and propose a model to explain how fiction works.
Curated OER
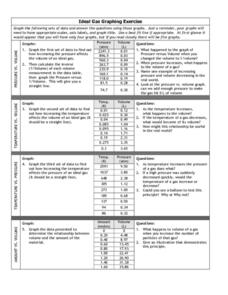
Graphing Exercise of Ideal Gas Data
In this graphing of Ideal Gas Data worksheet, learners use the given data to draw 4 graphs of the given data. They are given the pressure and volume to draw and interpret the graphs.
Other popular searches
- Reading Graph
- Reading a Graph
- Reading a Line Graph
- Timed Reading Graph
- Reading Double Line Graph
- Reading Plot Graph
- Free Reading Graph
- Speed Reading Graph
- Reading Fluency Graph
- Readinga Graph
- Fluency Graph
- Graph Reading Goals


