Curated OER
Worksheet #6, Exponents, Interest, and Radioactive Decay of Isotopes
In this calculus worksheet, learners sketch graphs of given exponential functions. They compute the principal needed to have a given ending balance when the interest is compounded at varying times. Students use a simple exponential model...
Flipped Math
Sequences
Develop a sequence of descriptions. Learners watch an introduction to sequences, their notations, and how to graph them. Pupils use full sentences to describe the sequence and how to get from one term to the next, without needing to...
Illustrative Mathematics
The Djinni’s Offer
The djinni in this resource offers gold coins. Learners use the properties of exponents to make their decision as one offer increases exponentially. This makes a great group project. As the commentary suggests, start by having groups...
Curated OER
Simplifying Expressions
In this simplifying expressions worksheet, students solve and complete 41 various types of problems. First, they simplify each expression and write using exponents. Then, students graph each function and state the domain and range. They...
Virginia Department of Education
Logarithmic Modeling
Explore logarithms and logarithmic regression. Young mathematicians first learn about inverse functions and about the logarithm function family. They take their newfound knowledge to use logarithmic functions to model situations and...
Curated OER
Population Models and Qualitative Analysis, Part 2
In this population model worksheet, students explore models of population growth using the Gompertz growth model and the exponential growth model. They sketch a graph of the slope function and determine possible solutions over time....
Curated OER
Population Biology
In this population activity, students will compare two graphs; one graph representing steady rate of growth and the other one showing exponential growth. Students will use these graphs to complete 3 short answer questions.
Curated OER
Parent Functions Reference
In this functions worksheet, learners explore the graphs of fifteen parent functions. This worksheet is meant as a reference for students.
Curated OER
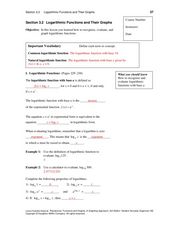
Logarithmic Functions and Their Graphs
In this algebra activity, learners evaluate, graph and solve logarithmic functions. They rewrite log functions and identify different log properties.
Curated OER
Analyze This Function
For this derivatives worksheet, students solve 11 short answer and graphing problems. Students find inflection points, increasing and decreasing intervals, maximums and minimums, and graph an exponential derivative. Students use the...
Concord Consortium
Rule of 72
Find an easier way to double it. Using the price of an item and the Consumer Price Index, learners determine how long it will be for the price to double. Scholars calculate the length of time it would take for the price to double using a...
Inside Mathematics
Population
Population density, it is not all that it is plotted to be. Pupils analyze a scatter plot of population versus area for some of the states in the US. The class members respond to eight questions about the graph, specific points and...
Curated OER
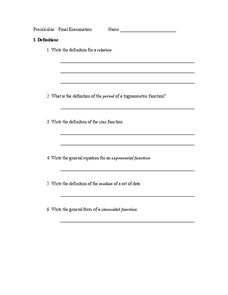
PreCalculus: Final Examination
For this final examination worksheet, students find the tangent function and sine function. They graph problems on a polar coordinate. Students describe trigonometric properties. This twelve-page worksheet contains 80 problems.
Curated OER
Derivatives of Elementary Functions
In this derivatives worksheet, students sketch the graphs of four functions. They write the derivatives of eight functions. Students complete two derivative tables.
Curated OER
Population Models and Qualitative Analysis
For this quantitative analysis worksheet, students explore the limits of a rate equation. They use quantitative analysis methods to determine the differential, plot graphs of their values, and describe the relationships between the...
Agile Mind
Rabbit populations
In this real-world problem about the rapid growth of rabbit populations, learners must analyze two different scenarios and create mathematical models to represent them. They use their exponential models to answer questions about the...
EngageNY
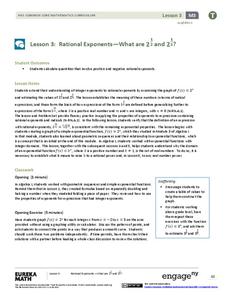
Rational Exponents—What are 2^1/2 and 2^1/3?
Are you rooting for your high schoolers to learn about rational exponents? In the third installment of a 35-part module, pupils first learn the meaning of 2^(1/n) by estimating values on the graph of y = 2^x and by using algebraic...
Achieve
Ivy Smith Grows Up
Babies grow at an incredible rate! Demonstrate how to model growth using a linear function. Learners build the function from two data points, and then use the function to make predictions.
Illustrative Mathematics
Modeling London's Population
Looking at London's population from 1801–1961 in 20 year increments, high school mathematicians determine if the data can be modeled by a given logistic growth equation. They explain their thinking and determine the values of each...
Achieve
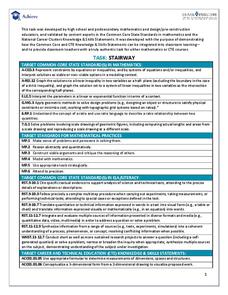
Stairway
It's the stairway to learning! Scholars research all aspects of building a staircase. Using information from building codes, they write and graph a system of inequalities to analyze the constraints. The completed project is a scale model...
Los Angeles County Office of Education
Assessment for the California Mathematics Standards Grade 7
In need of an all-inclusive seventh grade math resource? Packed full of the topics necessary for Pre-Algebra the packet includes practice problems with different difficulty levels. It works great for any supplemental use needed in the...
Curated OER
Solving Absolute Value Inequalities
Start this activity with a brief description of how to solve absolute value inequalities. A space is provided to help classify the inequalities into types (greater than, less than, or equal to) and for learners to show how to graph their...
West Contra Costa Unified School District
Point-Slope Application Problems
Create a linear equation for a problem when the intercept information is not given. The two-day lesson introduces the class to the point-slope form, which can be used for problems when the initial conditions are not provided. Pupils...
Curated OER
Strike a Pose: Modeling in the Real World (There's Nothing to It!)
Adjust this lesson to fit either beginning or more advanced learners. Build a scatter plot, determine appropriate model (linear, quadratic, exponential), and then extend to evaluate the model with residuals. This problem uses real-world...


