West Contra Costa Unified School District
Graphing Linear Inequalities Sort
Learners first determine the slope-intercept and standard forms of inequalities given graphs, and then determine key features of the graphs.
Curated OER
How Much Folate?
This task includes scaffolding to support the introduction of the writing and graphing of linear inequalities. Then your geometry learners discover that writing down all possible combinations is not feasible so they are led to use...
Curated OER
What Functions do Two Graph Points Determine?
Your algebra learners write linear, exponential, and quadratic equations containing the same two graph points in this collaborative task.
5280 Math
More or Less the Same
Tell the story of the math. Given a graph of a linear system, learners write a story that models the graph before crafting the corresponding functions. Graphs intersect at an estimated point, allowing for different variations in the...
Curated OER
Linear Functions
Your learners will explore linear functions by analyzing a graph of the linear equations.Then learners analyze through calculating f(x+P) and g(x+p)
Annenberg Foundation
Skeeters Are Overrunning the World
Skeeters are used to model linear and exponential population growth in a wonderfully organized lesson plan including teachers' and students' notes, an assignment, graphs, tables, and equations. Filled with constant deep-reaching...
Curated OER
Solution Sets
Here is a task that gives the graph of the solutions of a system of linear inequalities and asks learners to analyze and write the algebraic form of the systems. By turning the problem around, learners make the connections between...
Curated OER
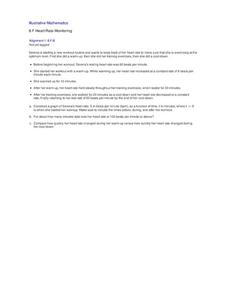
Heart Rate Monitoring
Algebra learners like this resource because it is easy to understand and it relates to their lives. Whether you are starting a new workout routine, or just climbing the stairs, your heart rate increases and decreases throughout the day....
West Contra Costa Unified School District
Slope-Intercept Sort
What's so special about slope? Pupils first match cards with slope and y-intercept to graphs of linear equations. They continue the lesson by matching equations in slope-intercept form to the same graphs.
Illustrative Mathematics
Video Streaming
Your movie fans will be interested in this resource. They will compare video streaming plans. One plan charges a set rate per month and a reduced viewing fee, and the other has a flat rate per each video viewed. Unfortunately, students...
PBL Pathways
Boogie Boards
Solve a complex business puzzle by building a linear programming model. An engaging project-based learning problem has classes examining transportation costs and manufacturing limitations from several plants. Ultimately, they use their...
Curated OER
Integer Solutions to Inequality
When is the last time you assigned your students only one problem? This seemly simple problem requires learners think like a mathematician and reason about how to solve this compound inequality in one variable. More than just using...
Curated OER
Basketball Bounces, Assessment Variation 2
This un-scaffold summative assessment tasks learners to use the height of a bouncing basketball, given the data in graph and table form, to choose the model that is represented. Learners then use the model to answer questions about...
Curated OER
Basketball Bounces, Assessment Variation 1
This highly scaffolded, summative assessment tasks learners to choose the model that represents the height of a bouncing basketball given the data in graph and table form. Learners then use the model to answer questions about the...
5280 Math
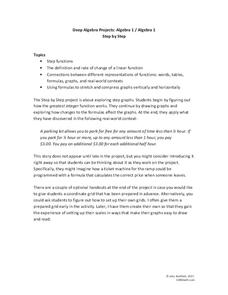
Step by Step
One step at a time! A seemingly linear relationship becomes an entirely new type of function. Young scholars build their understanding of step functions by completing a three-stage activity that incorporates multiple representations of...
101 Questions
Styrofoam Cups
How many cups does it take to reach the top? Learners attempt to answer this through a series of questions. They collect dimension information and apply it to creating a function. The lesson encourages various solution methods and...
Ms. Amber Nakamura's Mathematics Website
Algebra Project
What would your dream house look like? A cottage? A medieval castle? High schoolers enrolled in Algebra design the perfect house while using slopes to write equations for various aspects of the project.
Curated OER
A Model Solar System
If Earth is modeled by a grapefruit, what planet could be represented by a golf ball? This activity uses everyday and not-so-everyday objects to create a model of the Solar System.
Varsity Tutors
Varsity Tutors: Hotmath: Practice Problems: Graphing and Solving Systems of Linear Inequalities
Twenty problems present a variety of practice graphing and solving systems of linear inequalities. They are given with each step to the solution cleverly revealed one at a time. You can work each step of the problem then click the "View...
Texas Education Agency
Texas Gateway: Linear Inequalities
This activity provides an opportunity for students to examine how to find solutions to linear inequalities by graphing.
Sophia Learning
Sophia: Systems of Linear Inequalities in the Real World
The video lesson explores an example of how systems of linear inequalities can be applied in the real world.
Texas Instruments
Texas Instruments: Linear Inequalities
In this question set, students are asked to solve inequalities in one variable, graph linear inequalities, and graph systems of linear inequalities. Questions are multiple choice and true/false; solutions are included.
Texas Instruments
Texas Instruments: Linear Inequalities: Using Graphs and Tables
Students learn to estimate the solution set, in real numbers, of a linear inequality using graphical methods on a number line and on a Cartesian (x-y) graph. They also learn how to solve inequalities using tables.


