Curated OER
Data Analysis
In this data analysis worksheet, students solve and complete 4 different types of problems. First, they reduce the data provided to find the means, and graph the means in a line graph. Then, students graph the data from each mixture...
Curated OER
Positive Future Fair Project
Ninth graders view the film "Pay It Forward" and discuss what kind of public campaign is needed to move people to positive action. They consider different ways of presenting information (graphs, visual displays, etc.) as tools for...
Math Worksheet Center
Linear Quadratic Systems
In this linear quadratic system learning exercise, learners explore a system with a linear and a quadratic equation. With the given equations, students graph the parabola. They identify the axis of symmetry, the slope, points of...
Curated OER
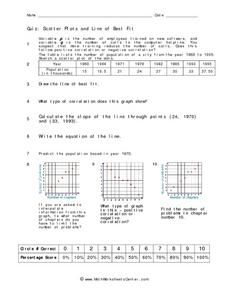
Quiz: Scatter Plots and Line of Best Fit
In this scatter plots and line of best fit activity, students create scatter plots from given sets of data. They answer questions concerning the scatter plot. Students write the equation of a line, identify the type of correlation...
Curated OER
Inverse Reciprocals Quiz
In this algebra worksheet, students determine the inverse and reciprocal for 6 problems using a table and a graph.
Curated OER
Data Analysis Digital Display
Students create a survey online. In this math lesson, students graph survey data using flisti.com. They share and analyze their classmates' histogram.
Curated OER
Six Squares
Students create different shapes on grid paper. In this two-dimensional geometry lesson, students take turns outlining a shape made of six squares on the graph paper. They identify all shapes they see once everyone has had a turn.
Curated OER
Statistics
In this statistics instructional activity, students view 6 graphs to determine the correlation. Students then answer 4 questions that involve plotting data, determining a relationship, and making predictions.
Curated OER
Recording Data From a Survey Reteaching Worksheet
In this recording data from a surveys reteaching worksheet, 2nd graders review the use of tallies when recording data. They use the information to make a data table and a bar graph that displays the information.
Curated OER
Cereal Box Blocks and More!
Students sort and categorize different types of boxes and cartons. In this sorting lesson, students designate areas of the room to put different sizes, styles, or colors of boxes. They help their teacher count and graph the different...
Curated OER
College Prep Algebra, Worksheet Chapter 3, 2.5, 2.7, 3.1- 3.4
For this algebra worksheet, pupils translate 39 word problems into algebraic terms and solve them. They complete 42 problems about coordinate graphing, working with ordered pairs, slop, and equations of lines.. They make 2 scatter grams...
Curated OER
Equation of a Line
In this equation of a line learning exercise, 9th graders solve and complete 4 different multiple choice problems. First, they use the median fit method to determine the equation that most likely represents the line of best fit for the...
Curated OER
Interpreting a Pictogram
In this pictogram worksheet, students interpret a pictograph on ladybirds and answer 5 short answer questions or drawings referring back to the pictogram. Students carry out their own scenario pictogram and draw a table with their results.
Curated OER
Scatter Plots
In this scatter plots worksheet, students solve and complete 4 different problems. First, they use the table shown to model the relation with a scatter plot and trend line and to predict the value of a variable when given the other...
Curated OER
Graphic Favorite Breakfast Foods
Second graders graph data based on a class survey of their favorite breakfast foods. For this graphing lesson plan, 2nd graders take a class survey of their favorite breakfast foods. Then they take that data and put it into a computer...
Curated OER
Bus Graph
Young scholars make predictions about which bus takes the most/least students in the classroom. They use KidPix bus stamp for each student who goes home on that bus number and record data and discuss predictions.
Curated OER
Cost analysis
In this Algebra I worksheet, 9th graders analyze a problem in which basic assumptions must be made about cost and demand for the product or item. Students use a graph to make predictions and determine the best price at which to sell an...
Inside Mathematics
Printing Tickets
Determine the better deal. Pupils write the equation for the cost of printing tickets from different printers. They compare the costs graphically and algebraicaly to determine which printer has the best deal based upon the quantity of...
Education World
The African American Population in US History
How has the African American population changed over the years? Learners use charts, statistical data, and maps to see how populations in African American communities have changed since the 1860s. Activity modifications are included to...
Inside Mathematics
Quadratic (2009)
Functions require an input in order to get an output, which explains why the answer always has at least two parts. After only three multi-part questions, the teacher can analyze pupils' strengths and weaknesses when it comes to quadratic...
Inside Mathematics
Functions
A function is like a machine that has an input and an output. Challenge scholars to look at the eight given points and determine the two functions that would fit four of the points each — one is linear and the other non-linear. The...
Bowland
Mystery Tours – Plan Your Tour
Everyone loves a vacation and a set of three activities has groups planning a tour of the U.K. using given distance, time, and price data. They solve a variety of problems related to the trip and produce a report on the success of the trip.
Illustrative Mathematics
The Djinni’s Offer
The djinni in this resource offers gold coins. Learners use the properties of exponents to make their decision as one offer increases exponentially. This makes a great group project. As the commentary suggests, start by having groups...
Curated OER
Filling Up-Gasoline
In this fuel sources worksheet, students calculate the E85 alternative fuel costs per gallon compared to the cost of gasoline. Students complete a table to show the comparison prices. They create a triple line graph to show the...
Other popular searches
- Tables, Charts and Graphs
- Function Tables and Graphs
- Tables and Graphs
- Tables Charts and Graphs
- Create Data Tables From Graphs
- Math Tables and Graphs
- Reading Tables and Graphs
- Data Displays and Graphs
- Tables, Graphs, Charts
- Using Graphs and Tables
- Making Tables and Graphs
- Data Tables and Graphs


