Curated OER
The Bigger they Are . . .
Pupils do a variety of data analyses of real-life basketball statistics from the NBA. They chart and graph rebounding, scoring, shot blocking and steals data which are gathered from the newspaper sports section.
Curated OER
Walking the Plank
Eighth graders experiment with a bathroom scale, books and a plank to determine how weight readings change as distance is applied. They graph and interpret the results.
Curated OER
Plot! Analyze! Draw your Conclusions!
Students download data reported from the Global Sun Temperature Project website. They graph and analyze the data looking for trends and patterns. They prepare a class report with their observations and post it to the website.
Curated OER
You Gotta Have Heart
Ninth graders investigate the concept of relations and interpret graphs and tables. They analyze given data and look for a pattern to determine if the numbers represent a function. Students practice solving scientific word problems that...
Curated OER
Building Paper Bridges
Learners construct a bridge that can hold 100 pennies. In this math lesson, students evaluate the strength of their bridges. They predict how much weight a bridge can hold based on its design.
Curated OER
Price of Apples- Linear Data
Students collect data and create a graph. In this algebra lesson, students describe functions graphically, algebraically and verbally. They identify functions as being independent and dependent using variables.
Curated OER
Point Graphs
Students experiment with point graphs. In this math activity, students are divided into groups and perform an experiment to see how high a ball bounces, recording their results on a point graph. Students then answer provided questions.
Curated OER
Graphing in Science
Students manipulate and interpret data. They are given a dataset from a described experiment and interpret the data. A "How to Sheet for graphing" is included in lesson plan.
Curated OER
Batteries in Series
Eighth graders examine batteries in a series circuit and the associated voltage. They determine, through inquiry and problem solving, that the total voltage of batteries in a series is the sum of the voltage of each battery. They design...
Curated OER
Graphing Exercise of Ideal Gas Data
In this graphing of Ideal Gas Data worksheet, students use the given data to draw 4 graphs of the given data. They are given the pressure and volume to draw and interpret the graphs.
Curated OER
Worksheet 30
In this math worksheet, students imagine a situation where a weight is attached to a string and it is swung in a circle. Then they use vectors and derivatives to describe the motion.
Curated OER
Picasso's "The Butterfly"
Students draw a butterfly. For this drawing lesson, students explore a drawing upside down. Students sketch a butterfly while the image is reversed to tap into their right brain dominance.
Curated OER
A Second Quiz on Subject-Verb Agreement
In this subject/verb agreement online interactive instructional activity, students respond to 12 multiple choice questions. After students answer the questions, they may see the grammar rules that apply to each of the questions.
Curated OER
Picasso's "The Dog"
Learners draw a dog. In this drawing lesson, students discover how to tap into their right brain dominance by sketching a picture upside down. Learners draw a picture resembling Picasso's "The Dog".
Curated OER
Discovering Pi
Students develop a formula that describes the functional relationship of the circumference of a circle to its diameter. Working with a partner, they measure the diameter and circumference of circular objects in order to discover the...
Curated OER
Describing the Motion of a Battery Powered Cars
Students explore distance a toy car travels by changing the amount of batteries used to power the toy car. In this force and motion lesson, students calculate the average speed of a car while investigating the power from various...
Curated OER
Planet Protectors
Students explore ways to protect the earth. In this environmental issues and technology instructional activity, students investigate the water quality in their community and compare their findings to the water quality in other...
Curated OER
Graphing Linear Equations
Students graph linear equations. In this algebra lesson, students investigate the price of tolls in different states and create a graph. They analyze their graph and draw conclusions.
Curated OER
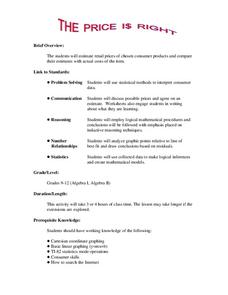
The Price Is Right
Students create a list of products with estimated prices. For this algebra lesson, students learn to write equations using variables. They match their created list with that of actual products and compare their prices,
Curated OER
The Closer I Get To You
Pupils explore the law of reflection. Through experimentation and problem solving, they collect and analyze data pertaining to reflection. The data is plotted on a graph and formulas for calculating the x and y values are evaluated.
Curated OER
Fact Families to 10
For this mathematics worksheet, 1st graders complete each fact family. Then they solve each addition and subtraction sentence using counter to show their sentence. Students also explain their idea of what a fact family is to them.
Curated OER
Endangered Species
Ninth graders graph data in order to compare the number of extinct species and a rise in human population. They analyze the data collected. Students are encouraged to infer the relationship.
Curated OER
Keeping Up Good Health
During a discussion on sweating with your little ones, this resource should come in handy. Little learners place a check mark next to an activity pictured on the learning exercise that would induce sweating. There are seven pictures to...
Curated OER
Composing Your Melody
In this music worksheet, learners perform a given melody of four phrases. Students also improvise their own melodies using notes G, A, C, D, and E.
Other popular searches
- Best Fit Line
- Best Fitting Line
- Math Best Fit Line
- Algebra Line of Best Fit
- Best Fit Line Worksheets
- Best Line of Fit


