Curated OER
Line of Best Fit
In this line of best fit learning exercise, students solve and complete 8 different problems that include plotting and creating their own lines of best fit on a graph. First, they study the samples at the top and plot the ordered pairs...
Virginia Department of Education
Line of Best Fit
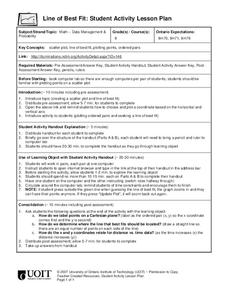
Pupils work through a guided activity on fitting a linear equation to a set of data by entering the data into a calculator and trying to envision a line of best fit. They then have the calculator determine the least-squares line and...
CK-12 Foundation
Fitting Lines to Data
Scatter the TV sales over weeks. Pupils create a scatter plot to display the number of TV sales over a period of several weeks. The interactive allows class members to create two lines of best fit. Then they determine which line fits...
Charleston School District
The Line of Best Fit
If it's warm, they will come! Learners find a line of best fit to show a relationship between temperature and beach visitors. Previous lessons in the series showed pupils how to create and find associations in scatter plots. Now,...
Curated OER
Animal Brains
Do big bodies make big brains? Let your learners decide whether there is an association between body weight and brain weight by putting the data from different animals into a scatterplot. They can remove any outliers and then make a line...
Curated OER
Scatter-Brained
Seventh graders graph ordered pairs on a coordinate plane. They create a scatterplot. Additionally, they determine the line of best fit and investigate the slope of the line. Multiple resources are provided. An excellent resource!
Curated OER
Line of best fit
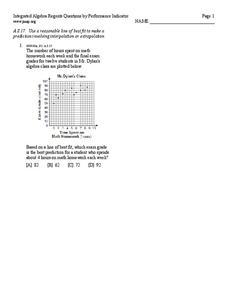
In this Algebra I/Algebra II worksheet, students determine the line of best fit for a scatter plot and use the information to make predictions involving interpolation or extrapolation. The one page worksheet contains one multiple...
West Contra Costa Unified School District
Correlation and Line of Best Fit
Computers are useful for more than just surfing the Internet. Pupils first investigate scatter plots and estimate correlation coefficients. Next, they use Microsoft Excel to create scatter plots and determine correlation...
Virginia Department of Education
Linear Curve of Best Fit
Is foot length to forearm length a linear association? The class collects data of fellow scholars' foot length and the length of their forearms. They plot the data and find a line of best fit. Using that line, they make predictions of...
Curated OER
How Long Can You Go?
Eighth graders examine the usefulness of a line of best fit by collecting and graphing data, using a graphing calculator to determine the line of best fit, and making a variety of predictions. They watch a video, then design a...
Willow Tree
Approximating a Line of Best Fit
You may be able to see patterns visually, but mathematics quantifies them. Here learners find correlation in scatterplots and write equations to represent that relationship. They fit a line to the data, find two points on the line, and...
Centre for Innovation in Mathematics Teaching
Ten Data Analysis Activities
This thirteen page data analysis worksheet contains a number of interesting problems regarding statistics. The activities cover the concepts of average measurements, standard deviation, box and whisker plots, quartiles, frequency...
American Statistical Association
Scatter It! (Predict Billy’s Height)
How do doctors predict a child's future height? Scholars use one case study to determine the height of a child two years into the future. They graph the given data, determine the line of best fit, and use that to estimate the height in...
Shodor Education Foundation
Regression
How good is the fit? Using an interactive, classmates create a scatter plot of bivariate data and fit their own lines of best fit. The applet allows pupils to display the regression line along with the correlation coefficient. As a final...
Curated OER
Lines of Best Fit
Students explore the concept of line of best fit. In this line of best fit lesson, students find lines of best fit in examples about riding your bike home from school and dentistry. Students find two data points and find the line of best...
Curated OER
Lines of Best Fit
High schoolers determine if there is an associationm in a scatter plot of data. They analyze data through predictios, comparisons, and applications. Students calculate the line of best fit using a graphing calculator. They display data...
Curated OER
Line of Best Fit
Students identify the line of best fit. In this statistics lesson plan, students collect and analyze data. They calculate the regression equations and identify the different types of correlation.
Curated OER
Line of Best Fit
Students calculate the equation of the line of best fit. In this statistics instructional activity, students create scatter plots and find the line of best fit going through their data. They make predictions and draw conclusions.
Curated OER
Line of Best Fit
Students explore the concept of linear regression. In this linear regression lesson, students do a Barbie bungee activity where they collect linear data. Students plot their data using a scatter plot. Students determine a line of best...
American Statistical Association
What Fits?
The bounce of a golf ball changes the result in golf, mini golf—and a great math activity. Scholars graph the height of golf ball bounces before finding a line of best fit. They analyze their own data and the results of others to better...
Shodor Education Foundation
Data Flyer
Fit functions to data by using an interactive app. Individuals plot a scatter plot and then fit lines of best fit and regression curves to the data. The use of an app gives learners the opportunity to try out different functions to see...
Curated OER
Linear Modelling of the Life Expectancy of Canadians
Middle and high schoolers explore the concept of linear modelling. In this linear modelling lesson plan, pupils find the line of best fit for life expectancy data of Canadians. They compare life expectancies of men and women, and...
Curated OER
A Sweet Drink
Students investigate reaction rates. For this seventh or eighth grade mathematics lesson, students collect, record, and analyze data regarding how the temperature of water affects the dissolving time of a sugar cube. Studetns...
Mathed Up!
Scatter Graphs
Make an estimate by getting in line. The class works with scatter plots and lines of best fit to make an estimate for given values. Pupils determine whether there is a positive or negative correlation and draw a best-fit line. Using the...
Other popular searches
- Best Fit Line
- Best Fitting Line
- Math Best Fit Line
- Algebra Line of Best Fit
- Best Fit Line Worksheets
- Best Line of Fit


