Curated OER
Applied Science - Science and Math Lab 4B
Learners experiment with the combination of vinegar and baking soda. In this applied science lesson, future scientists compare qualitative and quantitative data collected from their exploration. Then they work together to analyze and...
Omaha Zoo
I Like to Move It
What do lemurs do best? They move! Lemurs like to jump, run, hop, and climb and it's your class's job to document seven fun lemur behaviors. The class starts by discussing why lemurs are considered primates, and then they isolate seven...
Curated OER
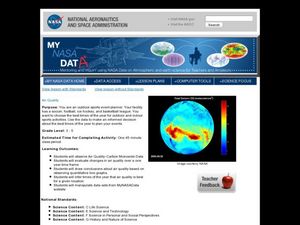
Air Quality
Students observe air quality and monoxide data. In this air quality lesson, students draw conclusions and manipulate data from a one year period on changes in air quality.
Perkins School for the Blind
The Mystery Box - Making Observations and Collecting Data
Making observations and collecting qualitative and quantitative data is a vital skill all scientists need to practice. Help your scientists with partial and no sight learn how to use their other senses to make observations for...
Cornell University
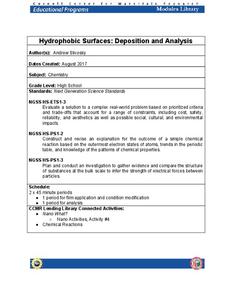
Hydrophobic Surfaces—Deposition and Analysis
Couches, carpets, and even computer keyboards now advertise they are spill-resistant, but what does that mean? Scholars use physical and chemical methods to coat surfaces with thin films to test their hydrophobic properties. Then they...
Curated OER
Bloodstain Pattern Simulations: A Physical Analysis
Students receive bloodstain pattern evidence from a crime scene. They answer a series of questions through inquiry, observation, measurement, and analysis. Pupils complete this challenge, by reconstructing the evidence through four...
Chicago Botanic Garden
Historical Climate Cycles
What better way to make predictions about future weather and climate patterns than with actual climate data from the past? Young climatologists analyze data from 400,000 to 10,000 years ago to determine if climate has changed over...
Curated OER
Graphing and Analyzing Biome Data
Students explore biome data. In this world geography and weather data analysis lesson, students record data about weather conditions in North Carolina, Las Vegas, and Brazil. Students convert Fahrenheit degrees to Celsius degrees and use...
National Wildlife Federation
Quantifying Land Changes Over Time Using Landsat
"Humans have become a geologic agent comparable to erosion and [volcanic] eruptions ..." Paul J. Crutzen, a Nobel Prize-winning atmospheric chemist. Using Landsat imagery, scholars create a grid showing land use type, such as urban,...
Curated OER
What's in a Graph?
How many yellow Skittles® come in a fun-size package? Use candy color data to construct a bar graph and a pie chart. Pupils analyze bar graphs of real-life data on the Texas and Massachusetts populations. As an assessment at the end...
Pingry School
An Introduction to Qualitative Analysis
Compounds take on different properties than their elemental components. How can scientists determine those elements? A lab-based activity has learners explore several double replacement reactions to analyze compounds qualitatively. They...
Curated OER
2006 U.S. National Chemistry Olympiad Part III
For this chemistry Olympiad lab worksheet, high schoolers are given two lab problems to design experiments. Topics include determining the mass percentage of a given compound and determining an unknown metal using quantitative and...
Cornell University
Density
Certain things just do not mix, including liquids of varying densities. Learners collect data to determine the densities of several liquids. They then use the density information to predict the type of liquid.
Curated OER
Applied Science - Science and Math Post-Lab
Students explore optical illusions. In this Applied Science lesson plan, students view optical illusions and record the data of what they see. Students graph the data that they collect.
Curated OER
Qualitative and Quantitative Data
Seventh graders study the different ways that they have been evaluated over the years. In this qualitative and quantitative instructional activity students complete a learning activity while in groups.
Curated OER
Examine the Data
Seventh graders examine a teacher-created database and identify specific variables and develop hypothesis statements as to their possible effect. They create a summary statement either proving or disproving their hypothesis.
K20 Learn
Bavaria Has Issues...Experimental Components
Do you want to be a detective by analyzing situations? An engaging lesson provides young historians with the tools to help them understand the difference between data types and how to analyze them to draw conclusions. Scholars complete...
Curated OER
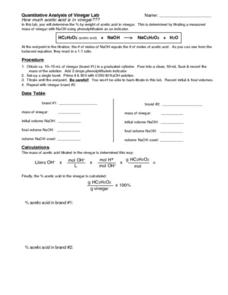
Quantitative Analysis of Vinegar Lab
In this quantitative analysis worksheet, students perform a lab to determine the amount of acetic acid in vinegar by doing a titration. They use an indicator phenolphthalein to determine the endpoint of the titration.
Curated OER
Designing the Experiment and Answering the Question
Learners investigate scientific methods by analyzing an article from the Natural Inquirer. In this data analysis lesson, students read an article from the magazine and discuss at least 2 scientific methods that could be used to...
Curated OER
Earthquake Epicenter
Students use chart data to determine the location of the epicenter of an earthquake. This task assesses students' abilities to generalize and infer, organize data, interpret data, and apply mathematical concepts.
Curated OER
Designing a Germination Experiment
Students explore botany by participating in a seed experiment. In this plant nutrition lesson, students define several science experiment vocabulary terms like observation, treatment, and replicate. Students utilize soaked seeds in a...
Curated OER
What's in a Graph?
Students explore how to use and interpret graphs. The graphs are pulled from a variety of sources, and the activities ask students to interpret graphs. They start this lesson with knowledge of what a graph is. Students also know how to...
Chicago Botanic Garden
What Can Tree Rings Tell Us About Climate?
Tree rings are slightly thicker on the south side of the tree because it receives more sunlight. Part two in a series of five lessons helps learners analyze tree rings to determine the environmental conditions that caused size...
Curated OER
Using GLOBE Data to Study the Earth System (College Level)
Students use the GLOBE Website to locate and study environmental data. They use the GLOBE Graphing Tool to display data. Students describe the role of solar energy in the annual fluctuations of soil moisture. They describe reservoirs and...


