Curated OER
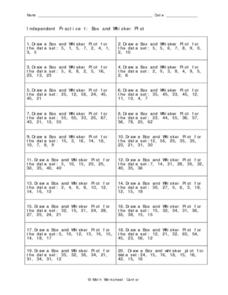
Independent Practice 1: Box and Whisker Plot
In this box and whisker plot instructional activity, students create a box and whisker plot from a given set of data. They identify the lower quartile, upper quartile, the mean, and outliers. This one-page instructional activity...
Willow Tree
Box-and-Whisker Plots
Whiskers are not just for cats! Pupils create box-and-whisker plots from given data sets. They analyze the data using the graphs as their guide.
Curated OER
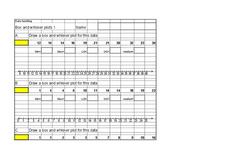
Box and Whisker Plots
In this math learning exercise, students compute the median of sets of numbers. They create box and whisker plots. Students identify the median, upper and lower quartiles, and minimum/maximum amounts. On the last page of this learning...
Curated OER
Exploring Data Sets and Statistics in Baseball
Students explore the concept data sets. In this data sets lesson, students find the 5 number summaries for salaries of teachers and compare them with 5 number summaries of professional baseball players. Students use box and whisker...
Curated OER
Statistics
In this statistics worksheet, students solve and complete 6 different problems that include determining various types of statistics. First, they determine the data set where the median value is equal to the mean value. Then, students use...
Curated OER
Statistics
In this statistics worksheet, 8th graders solve and complete 10 different problems that include the measures of variation in statistics. First, they determine the range, median, upper and lower quartiles, and interquartile range for each...
Curated OER
Statistics
In this statistics worksheet, 9th graders solve and complete 10 various types of problems that include using different types of graphs to illustrate data. First, they determine the median score for each stem-and-leaf plot. Then, students...
Curated OER
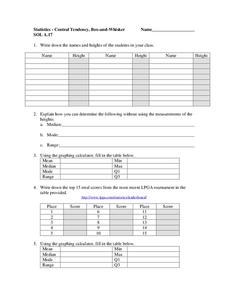
Central Tendency
In this central tendency worksheet, students solve and complete 10 different problems that include measures of central tendency. First, they write down the names and heights of students in their class. Then, students explain how they can...
Curated OER
Representing Data 2: Using Box Plots
What information can be gleaned from a box and whiskers plot? Discuss the five summary values - minimum, maximum, upper and lower quartiles, and median - and what conclusions can be made from these values? Included here is a matching...
Illustrative Mathematics
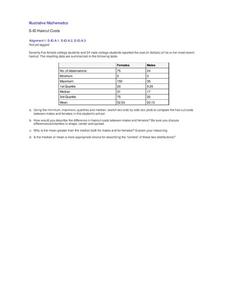
Haircut Costs
Who pays more for haircuts, men or women? Given quartile values, learners construct box and whiskers plots and interpret the results. They compare the mean and median, and discuss which is more appropriate under particular conditions....
Curated OER
Understanding Statistics
In this statistics worksheet, students examine and interpret pictographs and line graphs. Students analyze the provided data in order to create bar graphs, circle graphs, and box and whisker plots. The nine page worksheet accompanies a...
Virginia Department of Education
Box-and-Whisker Plots
The teacher demonstrates how to use a graphing calculator to create box-and-whisker plots and identify critical points. Small groups then create their own plots and analyze them and finish by comparing different sets of data using box...
Inside Mathematics
Archery
Put the better archer in a box. The performance task has pupils compare the performance of two archers using box-and-whisker plots. The resource includes sample responses that are useful in comparing individuals' work to others.
Curated OER
Data Analysis
In this data analysis worksheet, learners solve and complete 6 different problems that include using various types of data analysis. First, they create a stem-and-leaf plot of the ratios shown at the top and determine the mean, median,...
Curated OER
Statistics
Seventh and eighth graders solve and complete three various types of problems. First, they find the median rate using the box-and-whisker plot shown. Then, learners describe the inter-quartile range. In addition, they determine whether...
Curated OER
comparison of Two Gender Sports Teams
Learners gather data on sports team and create a box and whisper plot. In this data collection instructional activity, students find the median, the quartile range, and relationships between variables.
Curated OER
Box Plots
For this statistics worksheet, students analyze problems by finding the mean, median and mode. They also set data by their median, and quartiles. There are 7 questions dealing with 2 different sections.
Curated OER
Box-and-Whisker Plots
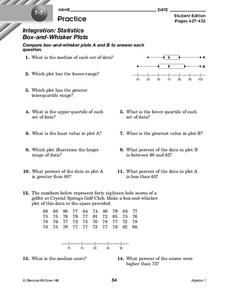
In this box-and-whisker plots worksheet, 9th graders solve and complete 14 different problems that include comparing various box-and-whisker plots. First, they determine the median for each set of data and plot the lesser range. Then,...
Mathed Up!
Cumulative Frequency and Box Plots
Learn how to display data. Young data analysts watch a video to review how to create cumulative frequency histograms and box plots. They work on a set of questions to practice producing these data displays.
Statistics Education Web
Are Female Hurricanes Deadlier than Male Hurricanes?
The battle of the sexes? Scholars first examine data on hurricane-related deaths and create graphical displays. They then use the data and displays to consider whether hurricanes with female names result in more deaths than hurricanes...
Mathematics Vision Project
Module 9: Modeling Data
How many different ways can you model data? Scholars learn several in the final module in a series of nine. Learners model data with dot plots, box plots, histograms, and scatter plots. They also analyze the data based on the data...
CCSS Math Activities
Smarter Balanced Sample Items: 7th Grade Math – Target H
Not one but two box plots. How will your pupils fare? Assess their understanding of box plots by having them compare two populations. The eighth of nine installments in the Gr. 7 Claim 1 Item Slide Shows series, the resource has them...
CCSS Math Activities
Smarter Balanced Sample Items: 6th Grade Math – Target J
What is the best measure of central tendency? Scholars explore mean, median, mode, range, and interquartile range to understand the similarities and differences. They display data in dot plots, histograms, box plots, and more as part of...
College Board
2004 AP® Statistics Free-Response Questions
Provide some practice showing the work. Pupils work through six free-response questions that require them to show their work. They use their knowledge of statistics to develop solutions to problems within context. Scenarios range from...
Other popular searches
- Quartile and Percentile
- Lower and Upper Quartile
- Inter Quartile Range
- Lower Quartile
- Upper Quartile
- Word Quartile
- Quartile Deviation
- Quartile Range
- Upper/lower Quartile
- Inter Quartile
- Percentile Quartile
- Outliers Inter Quartile Range


