Curated OER
Pythagorean Theorem: Triangles and Their Sides
Learners investigate triangles and their relationship to each other. In this geometry lesson, students solve right triangles using the properties of the Pythagorean Theorem. They differentiate between right, acute, straight and oblique...
Curated OER
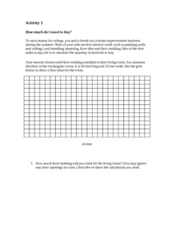
How Much Do I Need to Buy?
In this perimeter learning exercise, students solve five problems in which they calculate how much floor molding they need to buy for a living room. Students use the provided grid to draw the plan.
Curated OER
One-Step Equation Word Problems
In this word problem worksheet, students solve a total of 14 one-step equation problems. Answers are included on page 2; students are given space to show their work.
Curated OER
Model Data with Quadratic Functions
Students model data using quadratic equations. In this algebra lesson, students simplify and factor quadratic equations. They graph the function using collected data and analyze the parabola.
Curated OER
Length and Speed of a Robot
Young scholars calculate the speed and length of parts of the robot. In this algebra lesson, students measure the length of robots legs. They calculate the time it takes the robot to travel a specific distance.
Curated OER
Why Data
Students investigate and discuss why data is important. In this statistics lesson, students collect, graph and analyze data. They apply the concept of data and lines to finding the rate of change of the line created by the data.
Curated OER
Mean, Median and Mode
Students define mean, median, mode and outliers. For this statistics lesson, students analyze data using the central tendencies. They follow a path through a maze collecting data. They analyze the data using the mean, median and mode.
Curated OER
Faster speed-Shorter Time
Young scholars calculate the inverse variation, and speed given the formulas. In this algebra lesson, students investigate properties of conics, focusing on the hyperbola. They identify the distance between the directrix and other parts...
Curated OER
Constructing and Solving Linear Equations
Students construct and solve linear equations. In this algebra lesson, students solve equations and graph lines using the slope. They identify the different parts of an equation including the leading coefficient.
Curated OER
Fraction Word Problems
In this fraction worksheet, students solve a set of 8 word problems, all using fractions. A website reference is given for additional activities.
Curated OER
Let's Go Slopey
Young scholars create a table of values to graph a line. In this algebra lesson, students identify the slope and intercept of a linear equation. They use a Ticalculator to graph their function.
Curated OER
Entrance Ticket
Students collect data on different events and word problems. In this algebra lesson, students use a table to organize their data. They graph their coordinate pairs on a coordinate plane and make predictions.
Curated OER
Functions in Motion
Students graph polynomials functions and analyze the end behavior. In this algebra lesson, student differentiate between the different polynomials based on the exponents. They use a TI to help with the graphing.
Curated OER
Baseball Math
Young scholars collect data on baseball plays. In this statistics lesson, students graph their data and make predictions based on their observation. They calculate what the probability is that a favorable outcome would happen.
Curated OER
Effects of Parameter Changes
Students define properties of a quadratic equation. In this algebra lesson, students graph and factor quadratic functions. They write equations for polynomials, given a graph.
Curated OER
Addition: Four In a Row Addition Game
In this addition game worksheet, students find the sums of 25 single digit addition problems which are in a Bingo-like format. They work with a partner while writing the sums with two different colored pens until they make a row of...
Curated OER
Probability and Statistics
Students are taught to search the internet for statistics concepts on sports. In this probability lesson, students collect data and use the calculator to graph and analyze their data. They graph and make predictions about sports using...
Curated OER
Where is Triangle?
Students listen to songs to discover different shapes. They tape the shapes to their fingers and when they sing about that shape they are to show the shapes to each other.
Curated OER
Counting on Good Health
First graders engage in fun activities in order to understand the food pyramid and how to make healthy nutritional choices. The lesson plan is used in order to help students make healthy lifestyle choices.
Curated OER
Using Active Learning to Reinforce Mathematics
Students predict, then measure how far a bug can travel on a "course" over a specified amount of time, then construct graphs based on the data they acquire.
Curated OER
Range and Mode
In this range and mode worksheet, students read the math word problems and the numbers within the problem to help find the range and mode for each problem.
Curated OER
Rules for Multiplying Positive and Negative Numbers
In this algebra activity, students review the rules for multiplying positive and negative numbers using real life examples. There are no problems to solve however, this would be a great handout for students to keep in their note book.
Curated OER
Range and Measures of Central Tendency
Third graders take notes on a PowerPoint presentation featuring calculating and analyzing data. They practice skills highlighted in the presentation and create a table in Microsoft Excel showing data analysis.
Curated OER
How Acid Rain is Measured and Monitored in the U.S.
Explain how acid rain is measured. They discover how acid rain is monitored in the United States. They compare locally measured pH or rain with that of Great Smoky mountains. They perform Ph tests on rainfall they collect.
Other popular searches
- Athletics Running
- Cool Runnings
- Endurance Running
- Running Out of Time
- Running a Business
- Running Records Passages
- Running Mechanics
- Sports Lesson Plans Running
- Running Records
- Always Running
- Running for 2008 Elections
- Practical Athletics Running


