Curated OER
Inquiry Unit: Modeling Maximums and Minimums
Young mathematicians explore the maximun area for patio with the added complexity of finding the mimimum cost for construction. First, they maximize the area of a yard given a limited amount of fence and plot width v. area on a scatter...
Curated OER
Dental Impressions
What an impressive task it is to make dental impressions! Pupils learn how dentists use proportional reasoning, unit conversions, and systems of equations to estimate the materials needed to make stone models of dental impressions....
Curated OER
Systems of Equations
For this algebra worksheet, students factor systems of equations using elimination and substitution. THey graph their lines and find the point of intersection. There are 15 questions.
Curated OER
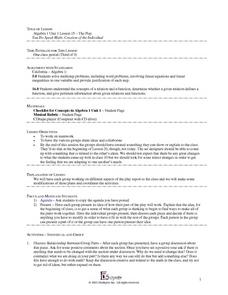
Algebra I: The Play
Learners create their plays to demonstrate concepts from Algebra I. They collaborate in small groups to add music and dancing to their plays. They analyze the suggestions from the previous class as they revise their plays.
Curated OER
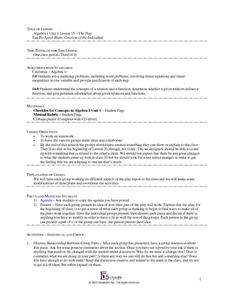
Algebra I: The Play
Learners revise their Algebra plays. They collaborate in small groups to work on different aspects of the play and report to the class. They make modifications to their plans and review the Musical Rubric to incorporate the concepts...
Curated OER
Slope & Rate of Change
This short handout addresses the concept of slope in two different ways: geometrically and analytically. Start with a brief description of slope, then use graphical representations to compare positive vs. negative slope and zero vs....
Virginia Department of Education
Factoring for Zeros
Relate factors to zeros and x-intercepts. Scholars first graph quadratics in both standard and factored forms to see that they are the same. They go on to use the graphs to see the relationship between factors and x-intercepts.
Curated OER
How Alike Are We?
Fourth graders find the range, mode, median, and mean for each of the data sets (height and shoe size). They discuss which measure of central tendency for each data set best represents the class and why. Students graph the shoe size and...
Alabama Learning Exchange
Investigating School Safety and Slope
Learners investigate the slope of various stairways through a "news report" approach and employ mathematical knowledge of applied slope to report on wheelchair accessibility and adherence to Americans with Disabilities Act. They...
Curated OER
Algebraic Equation Manipulation for Electric Circuits
In this electric circuit worksheet, students use Algebraic equations to manipulate the electrical resistance of a conductor. The answer a series of 19 open-ended questions. This worksheet is printable and the answers are revealed online.
Curated OER
Mr. Payne Word Search Puzzle
In this language arts worksheet, learners study 10 words in a word bank, then locate them in a word search puzzle. The words appear to be related to algebra; the meaning of the title is not known. There is one misspelled word in the word...
Curated OER
What Are The Chances
Pupils calculate the probability of an event occurring. In this probability lesson, students differentiate between independent, dependent or compound events. They find the range of the data.
Curated OER
Optimization For Breakfast
Pupils identify he proportion of a cereal box. In this algebra lesson, students define the relationship between patterns, functions and relations. They model their understanding using the cereal box.
Curated OER
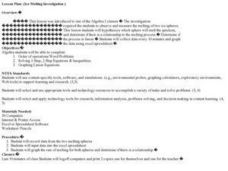
Ice Melting Investigation
Students conduct an ice melting investigation in which they observe and measure the melting of two ice spheres. They develop a hypothesis as to which sphere will melt the fastest, collect data every ten minutes, and graph the data using...


