Curated OER
Spreadsheet Graphs
Students create graphs using information from spreadsheets. They select a topic from the following choices: website use, digital cameras, spreadsheets, calculators or educational software. They tally the class results and create an...
Curated OER
Computer Technology - Big Stepper Block Buster
Students use their document processing, spreadsheet, and/or electronic presentation skills to complete a cross curricular project during the semester (or trimester, etc.,) in which they are enrolled in the Computer Technology course.
Curated OER
MAISA and the REMC Association of Michigan
Students complete online research to study geography's impact on weather. In this geography and weather lesson, students research weather in their city for ten days using an online website. Students bookmark the site, enter data into a...
Curated OER
European Elevation Sort
Given a prepared database of European countries, sixth graders sort the countries in ascending order by elevation and identify the five countries with the highest elevations. This cross-curricular lesson combines elements of computer...
Curated OER
Window-Eyes Lesson 11 Numbers and Capitalization Alert In the Screen Menu
Students practice using the Window Eyes setting to work with numbers settings, and upper and lower case letter alerts.
Curated OER
Skittles Candy Count
Students study how to use formulas, edit the spreadsheet, and create and edit charts. They add data to a spreadsheet, format it, add a chart and format it. They count the number of each color of Skittles and record it onto their Candy...
Curated OER
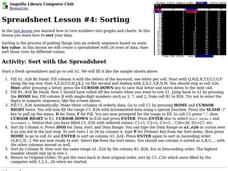
Sorting
Learners examine how sorting is the process of putting things into an orderly sequence based on some key value. In this lesson students create a spreadsheet with 26 rows of data, then sort those rows by different values.
Curated OER
Creating a Nutrition Table in MicroSoftExcel
Students access the internet to find Nutritional information from a restaurant of their choice and compile their information into an excel spreadsheet.
Curated OER
Party Math
Learners create a spreadsheet that they will use to plan a small party or outing. They calculate expenses and stay within a budget amount for their party.
Curated OER
EXCEL It!
Students surf the Web gathering information about graphs. The data collected is incorporated into an Excel spreadsheet and graphs of varying nature generated to further enhance student understanding.
Curated OER
Don't Settle for a Byte... Get the Megabyte on Technology
Students use word processing, presentation, and spreadsheet software. In this multi-day computer software usage lesson, students complete a research project that requires the use of a word processor, Excel, FrontPage, and PowerPoint to...
Curated OER
Great Graphing
Students collect data, use a computer spreadsheet program to create various graphs, and compare the graphs. They state the findings of each graph in writing and decide which graph type best represents the data.
Curated OER
The Solar Cycle
Students research the solar cycle. In this Science lesson, students use the internet to investigate the solar cycle. Students produce a spreadsheet and graph from the information collected.
Curated OER
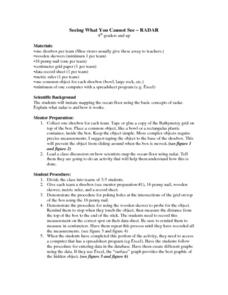
Seeing What You Cannot See--RADAR
Student imitate mapping the ocean floor using the basic concepts of radar. Then they explain what radar is and how it workds. All of their measurements are recorded on a data sheet. Then the data is entered into a spreadsheet program. A...
Curated OER
Graphing Favorite Colors
Third graders collect data and insert it into ClarisWorks to create a spreadsheet/graph of their favorite color. They interpret the data together.
Texas Education Agency (TEA)
Advanced Technical Skills in Business
Scholars put their technical skills to the test as they practice writing a business letter, creating charts and spreadsheets, and designing a flyer. Additionally, pupils create a PowerPoint presentation about a professional topic of...
Curated OER
Temperature High and Lows
Young scholars gather high and low temperature readings through email. In this temperature graphing activity, students use a spreadsheet to input data for a graph. young scholars interpret the graphs to compare and contrast the data from...
Curated OER
How Much Is It?
Students explore foreign currencies. In this foreign currencies lesson plan, students simulate travel to another country and determine the value of the US dollar compared to other countries. Students use a conversion table and search...
Curated OER
Memory Game
Young scholars create cards for a memory game by entering data into a spreadsheet that is then merged into a word processing document. Tutorials are available through links on the lesson page.
Curated OER
Interest Calculation and Spreadsheets
Students, while in the computer lab working on a spreadsheet program, calculate interest and accumulated value of a savings plan. They follow specific directives on how to create their spreadsheets. At the end of the lesson they print...
Curated OER
Using Computers to Produce Spreadsheets and Bar Graphs
Students review graphing terminology and how to plot data points, how to input data into a spreadsheet, and how to make a chart using a computer.
Curated OER
Weather Watchers
Students practice using objective and quantitative means to describe and compare the weather. They compile weather conditions and create a spreadsheet to record their findings.
Curated OER
Favorite Farm Animals
Students perform a study of farm animals and their babies. They compile a graph of their favorite farm animals. They utilize a spreadsheet worksheet which is imbedded in this plan.
Curated OER
Microsoft Access Lesson Plan
Third graders read children's literature during the school year and compile a list of books and genres in an Access database. They print out a report of all the different books and genres of they read over the whole school year.
Other popular searches
- Spreadsheets
- Excel Spreadsheets
- Budget Spreadsheet
- Favorite Foods Spreadsheet
- Microsoft Excel Spreadsheets
- Candy Wrapper Spreadsheet
- Basic Spreadsheet Skills
- Spreadsheet Lesson Plans
- Meteorology and Spreadsheets
- Using Excel Spreadsheets
- Amusement Park Spreadsheet
- Creating a Spreadsheet


