Curated OER
Introduction to Graphical Representation of Data Sets in Connection with Nuclear Decay
Young scholars record data, make observations, and share in experimentation and discussion of numerical experiments.
Curated OER
Saving An Endangered Species
Second graders work in groups in order to look at specific internet sites for animal adoption and sponsorship. They select an endangered species, determine needed funds, develop, advertise, and carry out a fund-raising plan.
Curated OER
Confusing Colors!
Fourth graders collect data, graph their data, and then make predictions based upon their findings. They's interest is maintained by the interesting way the data is collected. The data collection experiment is from the psychology work of...
Curated OER
All Those Advertising Dollars!
Students calculate percent increases (or percent decreases) for the top 25 companies in terms of advertising dollars spent during a year.
Curated OER
Graph Your Foot!
Students measure their own foot and place the outline on a graph. They make connections between the size of their foot and the bar graph that represents it.
Curated OER
Geography: Snow Cover on the Continents
Students create maps of snow cover for each continent by conducting Internet research. After estimating the percentage of continental snow cover, they present their findings in letters, brochures or Powerpoint presentations.
Curated OER
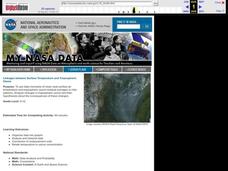
Linkages Between Surface Temperature And Tropospheric Ozone
High schoolers organize and analyze data regarding changes in tropospheric ozone and then hypothesize about the consequences of these changes.


