Curated OER
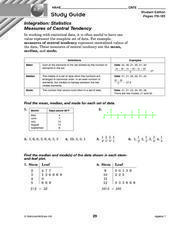
Integration: Statistics
For this math worksheet, students find the mean, median and mode for 6 number sets. Students then find the median and mode for data found in 2 stem-and-leaf plots.
Curated OER
Integration: Geometry - The Pythagorean Theorem
In this math worksheet, students are given that c is the hypotenuse of a right triangle. Students must find 12 sets of missing measures. Students also use the Pythagorean Theorem to determine whether a given set of measures would form a...
Texas Instruments
Measure Up!
Statisticians take things to new heights using a set of height measurements. Students use TI-82 or TI-83 calculators to determine extreme values and the median for the data. They also construct a box-and-whisker plot to summarize the...
Curated OER
Midpoints and Segment Congruence
In this midpoint worksheet, students use a number line to find the midpoint of a line segment. Next, they find the midpoint of a line using the coordinate plane. Examples of how to use each method are given at the beginning of the...
Curated OER
A Penny Saved is a Penny Earned
Learners explore the concept of exponential growth. In this exponential growth instructional activity, students manipulate power models with base 2. Learners discuss what would happen if you doubled a penny over the course of 20 days. ...
Curated OER
Math A Regents Questions: Points on a Line
In this linear equations worksheet, students solve 3 multiple choice problems. Students determine if a given point lies on a line given an equation of that line.
Curated OER
Math B Regents Questions by Performance Indicator: Logarithms
For this logarithms worksheet, students solve logarithm equations. They read story problems and find equivalent expressions to given logarithms. This three-page worksheet contains 13 problems. Answers are provided on the last page.
Natinal Math + Science Initative
Slope Investigation
Context is the key to understanding slope. A real-world application of slope uses a weight loss scenario with a constant rate of change to introduce the concept of slope of a line, before it makes a connection to the ordered pairs and...
Texas Instruments
Function Notation - Texas Instruments
Using a TI-Nspire calculator, learners will work to better understand function notation and input/output functions. They write equations with a function symbols, identify what makes an equation a function, and graph lines in order to...
Kenan Fellows
Lego Thinking and Building
Run a simulated airplane manufacturing plant with your pupils as the builders! Learners build Lego airplane models and collect data on the rate of production, comparing the number produced to the number defective. Using linear...
Curated OER
Set Design
Students explore proportional reasoning. In this middle school mathematics lesson students investigate scale drawings as they create a proportional representation for the carvings on Mt. Rushmore.
Curated OER
Number Sense: Real Numbers
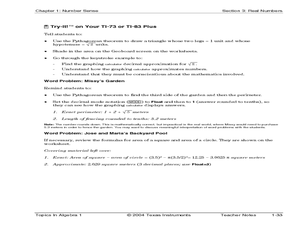
Using a scientific calculator and an 11-page guide sheet, middle schoolers investigate real numbers and problem-solving properties. The publisher links this resource to Common Core standard for seventh grade math, but you may find it a...
Curated OER
Indy 500
Start your engines! Small groups collect data from websites pertaining to the Indianapolis 500 in order to determine average speed per lap and miles in each lap. The lesson requires prior knowledge of the the formula d=rt.
Curated OER
Function Graphing--ID: 8252
Those graphing calculators can be tricky; good thing Texas Instruments has devised a lesson on how to use their TI-Nspire calculator to graph functions. Kids investigate functional notation as they graph ordered pairs in the form (a,...
Curated OER
An Introduction to Sequences
Fourth graders are introduced to arithmetic and geometric sequences. In this mathematics lesson, 4th graders produce a variety of sequences by varying the starting number, multiplier, and the add-on number.
Curated OER
Baseball Relationships - Using Scatter Plots
Students use graphing calculators to create scatter plots of given baseball data. They also determine percentages and ratios, slope, y-intercepts, etc. all using baseball data and statistics.
Curated OER
Spaghetti Graphs
Students work in pairs to test the strength of spaghetti strands. They collect and graph data to determine a line of best fit. Students create a linear equation to interpret their data. Based on the data collected, students predict...
Curated OER
Linear Equations
Seventh graders explore battle plans using grids. In this linear equation lesson, 7th graders see how math is used in battle. Students create a grid on the floor using tape and plastic army men to serve as the points. Students discuss...
Curated OER
Lesson 3: Graphing Ordered Pairs on a Coordinate Plane
Students study how to graph ordered pairs on a coordinate plane. After a teacher demonstration, students work together to complete problems. They explain and share their answers. As an activity, they solve a mystery story about the...
Curated OER
Sales Spreadsheet
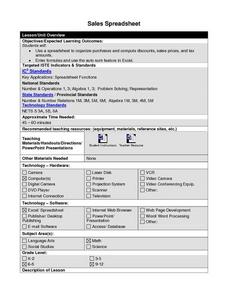
Students use Excel spreadsheets to organize purchases, discounts, sales prices, and sales tax. Students follow step by step instructions and enter formulas as well as use the auto sum feature to calculate required calculations.
Curated OER
Pythagorean Theorem Spreadsheet
Studetns use a spreadsheet to organize data on the sides of a triangle. They use the Pythagorean Theorem and the If then spreadsheet function to decide whether the three sides determine a right triangle. Middle schoolers work...
Curated OER
Curve Fitting
Pupils investigate linear, quadratic, and exponential regressions. They plot sets of data points, determine the regression equation that best fits the data and lastly investigate the coefficient of determination.
Curated OER
Percentages in Word Problems
Eighth graders, after brainstorming all the places they see percentages in every day life (sales, basketball, grades, etc.), calculate percentages from bases and parts in word problems. They review their notes together on percentage...
Curated OER
Graphing Calculator Investigation - Second Degree Polynomial Functions
Students solve quadratic functions. In this solving quadratic functions lesson, students determine the height of an object at a given time. Students determine the time at which an object hits the ground. Students answer questions...
Other popular searches
- Algebra 1 Powerpoint
- Algebra 1 Venn Diagrams
- Algebra 1 Game
- Algebra 1 Signed Numbers
- Algebra 1 Graphing
- Algebra 1 Lesson Plans
- Algebra 1 Weighted Averages
- Algebra 1 Notes
- Math Algebra 1
- History of Algebra 1
- Algebra 1 Powerpoint Review
- Algebra 1 Lessons


