Curated OER
Graphing Equivalent Fractions
Students graph families of equivalent fractions and compare them by observing the slope of the line formed by each fraction family. They place fractions in ascending order by comparing the slopes of each line after several families of...
Curated OER
Worksheet 9: Trig Functions
In this math worksheet, students are given 7 problems in which they write expressions for trig functions, compute limits and graph functions.
Illustrative Mathematics
Chocolate Bar Sales
In this real-world example, algebra learners start to get a sense of how to represent the relationship between two variables in different ways. They start by looking at a partial table of values that define a linear relationship. They...
Curated OER
Fast Talker - Ch 2 project
Tongue Twisters?! Create scatter plot graphs based on timing fellow classmates saying tongue twisters. Then investigate, display, and analyze the relationships based on functions. Wrap up this activity by making a...
Curated OER
Matrix Analysis of Networks
Explore the connection between a finite graph, a directed graph, and a matrix. Graph lines and identify the relationship of matrices in real-world scenarios. Then use this information to work with a partner to plan and design a...
West Contra Costa Unified School District
Multiple Representations of Equations
class members first work through finding the equation, table of values, graph, and key features of a linear function expressed verbally. Individuals then work through several more problems given different representations.
Curated OER
Completing the Square
Solve equations by completing the square. The pupils factor quadratic equations and graph the parabola. They also identify the different terms in the equation and look for patterns.
Curated OER
Piecewise Practice Problems
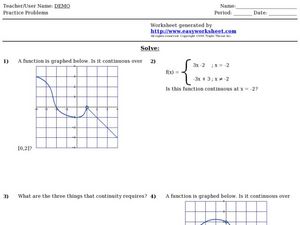
In this algebra worksheet, students validate continuity of a graph by a defined interval as well as determine continuity of a piecewise function.
Curated OER
US Airports, Assessment Variation
Determining relationships is all part of algebra and functions. Your mathematicians will decide the type of relationship between airports and population and translate what the slope and y-intercept represent. The problem is multiple...
Shodor Education Foundation
Ordered Simple Plot
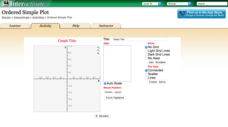
Open your imagination to make algebra-inspired creations. An interactive lesson has scholars graph images from a set of parameters. Users can practice minimum values, maximum values, and scale as well as key features.
Curated OER
Chairs Around the Table
Youngsters become flexible problem solvers with this challenging lesson. If there are 24 square tables in a restaurant, how many customers can be seated at one time? They can use manipulatives or draw pictures to help them find the...
Curated OER
Play It
There are a number of activities here that look at representing data in different ways. One activity, has young data analysts conduct a class survey regarding a new radio station, summarize a data set, and use central tendencies to...
Curated OER
An Introduction To Solving And Graphing Inequalities
Students graph inequalities and solve the equations. In this algebra lesson, students graph their solutions on a number line and create an inequality for a word problem.
Texas Instruments
Data Collection for Bar Graphs
Learners study the concept of central tendency in this data collection for bar graph lesson plan. They collect data outside as instructed and organize it into a bar graphs, then they list in specific groups the labels that appear on the...
Curated OER
Graphing Linear Inequalities
In this graphing instructional activity, students solve and graph linear inequalities on a coordinate plane. Inequalities contain one variable. The solution set is sketched and colored. This instructional activity contains eight...
Curated OER
Graphing Trig Functions
In this graphing trig functions activity, learners find the amplitude of each function. They graph the function. This four-page activity contains 12 problems. Answers are provided on the last two pages.
Curated OER
Graphing and Properties of Hyperbolas
In this graphing and properties instructional activity, students identify the vertices, foci of each hyperbola. They graph hyperbolas. Students identify asymptotes, the length of the transverse axis and the length of the conjugate axis....
Curated OER
Graph Logarithms
Mathematicians graph logarithmic equations. Teach your students how to identify the intercepts of logarithmic equations and tell whether the function is increasing or decreasing. They find the domain and range of each function.
Curated OER
Graphing Linear Equations
In this Algebra I activity, 9th graders write the equation of a line given the slope and the y-intercept and determine the equation of a line given the graph. The five page activity contains twenty-eight problems. Answers are...
Curated OER
Algebra II Test
In this algebra test, students must determine 3 definitions, match 4 equations to the answer, 4 short answer, and graph 4 points on a coordinate plane. There are 20 questions total.
Curated OER
Graphs & Equations of Lines
In this graphs and equations of lines worksheet, 10th graders solve 12 different problems that include graphs and various equations of lines. First, they determine the slope of a line that passes through two sets of points. Then,...
Curated OER
Quadratic-Linear Systems 2: Solve Systems of Equations Involving One Linear Equation and One Quadratic Equation Algebraically
In this solving systems of quadratic and linear equations, students complete three problems. The first problem asks students to solve a system of two equations. One of the equations is a quadratic and the other is linear. The second two...
Curated OER
Graphing Inequalities
Students graph linear equations and then find the person in class whose linear equation graph is perpendicular to theirs. In this graphing inequalities lesson plan, students graph their perpendicular slopes and then once their find their...
EngageNY
Structure in Graphs of Polynomial Functions
Don't allow those polynomial functions to misbehave! Understand the end behavior of a polynomial function based on the degree and leading coefficient. Learners examine the patterns of even and odd degree polynomials and apply them to...


