Howard County Schools
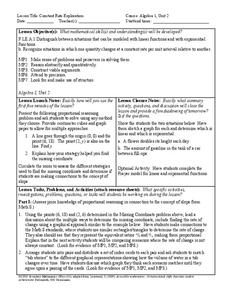
Constant Rate Exploration
Question: What do rectangles and bathtub volume have in common? Answer: Linear equations. Learn how to identify situations that have constant rates by examining two different situations, one proportional and one not proportional.
Curated OER
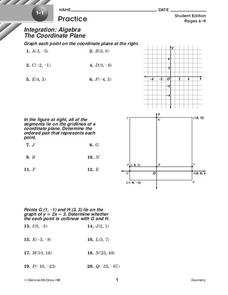
The Coordinate Plane
In this coordinate plane worksheet, 10th graders solve 20 various types of problems all related to identifying point on a coordinate plane. First, they graph each point on the coordinate plane at the top. Then, students determine the...
Curated OER
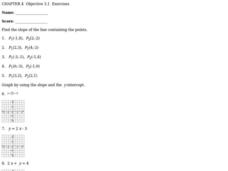
Slope of a Line
For this slope of a line worksheet, students solve ten problems determining the slope of points and an equation. First, they find the slope of the line containing the two points given in the first five problems. Then, students graph the...
Curated OER
Integrated Algebra Practice: Histograms
In this histogram worksheet, students solve 6 multiple choice and short answer problems. Students read histograms and determine the frequency of a particular item.
Curated OER
Mathematics Witing: Algebraic Processes and Its Connections to Geometry
Students, using manipulatives, determine how many different ways there are to arrange 3 and 4 objects. They organize and record their arrangements. Students investigate the pattern generated by 3 and 4 objects, they predict how many ways...
Curated OER
Integrated Algebra Practice: Box and Whisker Plots
In this box and whisker plot worksheet, students solve 5 short answer problems. Students use box and whisker plots to describe data and determine what percentile a piece of data belongs.
Yummy Math
US Holiday Candy Sales
Candy is a big business! Calculate the amount of money consumers spent on major holidays—Easter, Halloween, Christmas, Hanukkah, and Valentine's Day—based on the total amount of candy sales from 2011 and the percentage of each holiday's...
Concord Consortium
Gravity
Weight is a function of the distance from sea level. Learners explore the many implications of this fact in an inquiry-based task. Given the function, pupils answer questions before manipulating the function to rewrite the distance...
Curated OER
Graphing Inequalities
In this graphing inequalities worksheet, 6th graders solve and complete 24 different types of problems. First, they draw a graph for each given inequality. Then, students solve for each equation.
Curated OER
Exploring Exponential Growth and Decay Functions
Students differentiate between exponential growth and decay. In this algebra lesson, students solve exponential equations using properties of exponents. They use the Ti calculator to graph and analyze their functions.
Curated OER
Exploring Complex Roots
In exploring the concept of complex roots, students find the axis of symmetry and roots of parabolas. Then, they discuss what makes a solution complex and how to identify functions with complex roots.
Curated OER
Solving Absolute Value Inequalities
Start this activity with a brief description of how to solve absolute value inequalities. A space is provided to help classify the inequalities into types (greater than, less than, or equal to) and for learners to show how to graph their...
Curated OER
Off to College
High schoolers investigate linear, quadratic and exponential equations using the TI calculator. They identify relation and functions using ordered pairs, graph the data, analyze the data, and relate it to real-world situations.
Curated OER
Graphing Calculator Investigation - Second Degree Polynomial Functions
Students solve quadratic functions. In this solving quadratic functions lesson, students determine the height of an object at a given time. Students determine the time at which an object hits the ground. Students answer questions...
Curated OER
Writing Equations in Slope-Intercept Form
Use this worksheet to write equations in both point-slope form and slope-intercept form. Start by writing equations given one point and the slope and finish by writing equations given two points and a few real-world applications. The...
Curated OER
Rewriting Equations &Formulas
Practice with literal equations. Solve for one variable in terms of another. Find the value of y given specific values of x. This short worksheet would make a good warm-up activity at the beginning of class or a quick assessment at...
Curated OER
Solving Linear Systems by Linear Combinations
This worksheet offers six problems to practice solving simultaneous equations using the method of elimination. Start with systems that require multiplying only one of the equations. Then move to systems which require multiplying both...
Curated OER
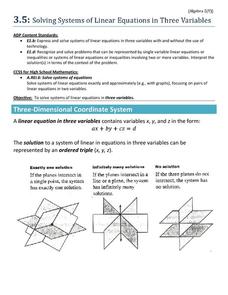
Solving Systems of Linear Equations in Three Variables
Practice solving linear systems of three equations with three unknowns using the elimination method and substitution method. This handout includes graphics of different combinations of intersecting planes to help illustrate the different...
Curated OER
The 400-Meters Race
Students collect and graph data. For this algebra lesson, students describe, interpret and analyze data. They follow a 400 meters race and plot the coordinates of the course. They graph a line to represent the data of the course.
Curated OER
Lines of Best Fit
High schoolers determine if there is an associationm in a scatter plot of data. They analyze data through predictios, comparisons, and applications. Students calculate the line of best fit using a graphing calculator. They display data...
Curated OER
Collecting Data
In this algebra instructional activity, students collect and analyze data. They graph and identify their solutions. There is one question with an answer key.
Curated OER
Making Connections
Eighth graders investigate the input/output model for building function tables. From the data, 8th graders connect tables, graphs, function rules, and equations in one variable. They work backwards to determine function rules for given...
Curated OER
The Derivative As a Function
For this derivative worksheet, students find the derivatives of given functions and graph a function. They identify the intervals which are increasing, decreasing or remain constant. This two-page worksheet contains approximately...
Curated OER
Graphing from Slope-Intercept Form: Practice A
Ninth graders investigate the slope-intercept form of a line. For this Algebra I lesson, 9th graders graph linear equations by using the slope and y-intercept.
