EngageNY
Revisiting the Graphs of the Trigonometric Functions
Use the graphs of the trigonometric functions to set the stage to inverse functions. The activity reviews the graphs of the basic trigonometric functions and their transformations. Pupils use their knowledge of graphing functions to...
Mathematics Assessment Project
Modeling Motion: Rolling Cups
Connect the size of a rolling cup to the size of circle it makes. Pupils view videos of cups of different sizes rolling in a circle. Using the videos and additional data, they attempt to determine a relationship between cup measurements...
EngageNY
Markup and Markdown Problems
There is a 100 percent chance this resource will help pupils connect percents to financial literacy. Young mathematicians use their knowledge of percents to find markups and markdowns in financial situations in the seventh segment in a...
EngageNY
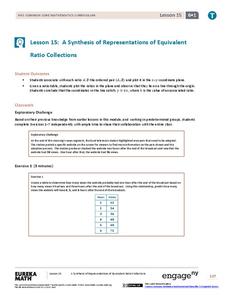
A Synthesis of Representations of Equivalent Ratio Collections
Make all the ratio representations fit together. The 15th segment in a series of 29 presents ratio problems to solve. Scholars use a variety of representations to respond to the questions. The problem set has pupils show how the...
Mathed Up!
Angles in Triangles and Quadrilaterals
This short video show viewers how to connect the sum of the angles in a triangle to other angle measurements. Pupils determine the missing measures for angles involved with triangles and quadrilaterals. Class members then must explain...
EngageNY
Analyzing a Graph
Collaborative groups utilize their knowledge of parent functions and transformations to determine the equations associated with graphs. The graph is then related to the scenario it represents.
EngageNY
More on Modeling Relationships with a Line
How do you create a residual plot? Work as a class and in small groups through the activity in order to learn how to build a residual plot. The activity builds upon previous learning on calculating residuals and serves as a precursor to...
EngageNY
Relationships Between Two Numerical Variables
Is there another way to view whether the data is linear or not? Class members work alone and in pairs to create scatter plots in order to determine whether there is a linear pattern or not. The exit ticket provides a quick way to...
EngageNY
Modeling from a Sequence
Building upon previous knowledge of sequences, collaborative pairs analyze sequences to determine the type and to make predictions of future terms. The exercises build through arithmetic and geometric sequences before introducing...
EngageNY
Analyzing a Data Set
Through discussions and journaling, classmates determine methods to associate types of functions with data presented in a table. Small groups then work with examples and exercises to refine their methods and find functions that work to...
EngageNY
Modeling a Context from Data (part 2)
Forgive me, I regress. Building upon previous modeling activities, the class examines models using the regression function on a graphing calculator. They use the modeling process to interpret the context and to make predictions based...
EngageNY
Modeling a Context from a Verbal Description (part 2)
I got a different answer, are they both correct? While working through modeling problems interpreting graphs, the question of precision is brought into the discussion. Problems are presented in which a precise answer is needed and others...
EngageNY
Population Problems
Find the percent of the population that meets the criteria. The 17th segment of a 20-part unit presents problems that involve percents of a population. Pupils use tape diagrams to create equations to find the percents of subgroups of the...
Charleston School District
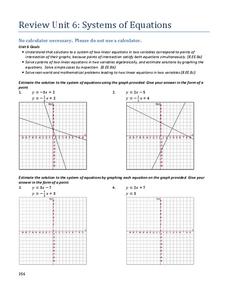
Review Unit 6: Systems of Equations
It's time to show off what they learned! The final lesson in the series is a review activity on the topics learned throughout the unit. Scholars solve systems of equations using graphic and algebraic methods, solve system-based word...
Illustrative Mathematics
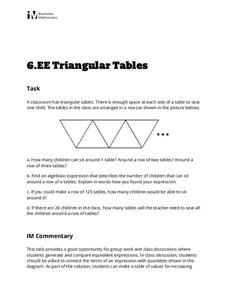
Triangular Tables
Somewhat of a puzzle, this problem gets pre-algebra preteens to write an expression representing a seating chart using triangle-shaped tables. This single task is an applicable lesson for meeting sixth grade Common Core math standards....
EngageNY
Writing Division Expressions II
Division is division is division is division ... four different ways to write division. Scholars continue to learn about division expressions. They translate between several forms, including verbal phrases, expressions using the division...
EngageNY
Replacing Letters with Numbers II
Teach about properties properly. Individuals investigate the commutative and identity properties for both addition and multiplication. They see that the properties hold true for all values by using substitution to test out several examples.
EngageNY
From Equations to Inequalities
Sometimes, equality just doesn't happen. Scholars apply their knowledge of solving equations to identify values that satisfy inequalities in the 34th installment of a 36-part module. They test given sets of numbers to find those that are...
EngageNY
Problems in Mathematical Terms
Whether scholars understand independent and dependent variables depends on you. The 32nd installment of a 36-part series has learners analyze relationships in real-world problems through tables. They determine independent and dependent...
Curated OER
US Airports, Assessment Variation
Determining relationships is all part of algebra and functions. Your mathematicians will decide the type of relationship between airports and population and translate what the slope and y-intercept represent. The problem is multiple...
Charleston School District
Pre-Test Unit 4: Linear Funcitons
Let your classes show you what they know! Use this pre-test to assess the current knowledge of your learners. The assessment includes all pre-algebra concepts related to functions: writing and graphing linear relationships, comparing...
Curated OER
Rounding and Subtracting
Common Core is all about getting your learners to open their minds and think about the why and how. This problem has them thinking about unknown numbers and their relationship with one another when we round and subtract. They will have...
California Education Partners
Colorful Data
Scale up your lessons with a performance task. Young data analysts work through an assessment task on scaled bar graphs. They answer questions about a given scaled bar graph on favorite colors, analyze a bar graph to see if it matches...
EngageNY
Trigonometry and Complex Numbers
Complex numbers were first represented on the complex plane, now they are being represented using sine and cosine. Introduce the class to the polar form of a complex number with the 13th part of a 32-part series that defines the argument...


