Curated OER
Translation of Shapes
Geometers graph figure translations, find coordinates for transformed figures, and write rules to describe transformations presented. The 2-page worksheet contains 14 problems, with answer key attached.
West Contra Costa Unified School District
Derivative – Standard Definition
Making a clear connection to algebra concepts helps learners understand the definition of a derivative. The lesson begins with looking at limits of simple linear and rational functions, and leads to the definition of the...
West Contra Costa Unified School District
Matching Quadratic Functions
Ever sigh when learners ask why they have to know so many different forms of the quadratic equation? Here is a lesson that comes in handy! Using hands-on matching activities, quadratic equations are explored through...
West Contra Costa Unified School District
Sneaking Up on Slope
Pupils determine the pattern in collinear points in order to determine the next point in a sequence. Using the definition of slope, they practice using the slope formula, and finish the activity with three different ways to...
Illustrative Mathematics
Do Two Points Always Determine a Linear Function?
Your learners can approach this task algebraically, geometrically, or both. They analyze the building of a linear function given two points and expand the concrete approach to the abstract when they are asked to find the general form of...
Inside Mathematics
Number Towers
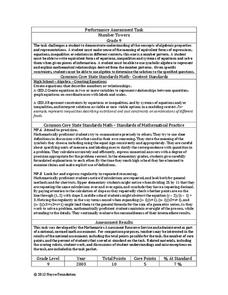
Number towers use addition or multiplication to ensure each level is equal. While this is common in factoring, it is often not used with algebraic equations. Solving these six questions relies on problem solving skills and being able to...
SHS Algebra
Linear vs. Exponential Functions Tasks
Your algebra learners will enjoy the real-life application of the three tasks presented here. They complete a table and a graph comparing the two options presented. One option is linear, while the other is exponential. After coming up...
Illustrative Mathematics
Find the Change
This exercise is an opportunity for algebra learners to understand the connection between the slope of a line and points found on the line. Use similar triangles to explain why slope m is the same between any two points. Discuss with the...
Curated OER
Systems of Linear Inequalities
In this Algebra I/Algebra II worksheet, learners solve systems of linear inequalities by graphing the inequalities on a coordinate plane and determining the location of all ordered pairs that solve the system. The three page...
Curated OER
Complex Numbers
In this algebra activity, 11th graders solve complex numbers using division. multiplication, addition and subtraction. There are 11 questions with an answer key.
Curated OER
Algebra II - Lesson 10-3: Circles
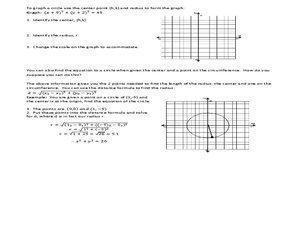
In this equations of circles worksheet, students solve 4 short answer problems. Students find an equation of a circle given the center and radius.
Curated OER
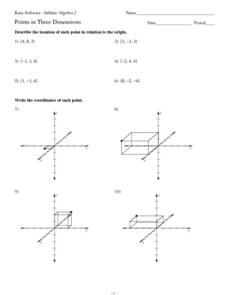
Points in Three Dimensions
In this plotting points worksheet, students plot 18 points in the 3-D plane. Students plot points on a graph given a point.
Curated OER
The Distance Formula
In this distance formula worksheet, students solve and complete 28 various types of problems. First, they find the distance between each pair of points provided. Then, students solve and graph the points.
Curated OER
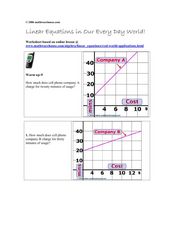
Linear Equations in Our Every Day World!
In this linear equations learning exercise, students read and interpret graphed linear equations. They read a story problem, write a linear equation, and plot the points on a coordinate plane. This five-page learning exercise...
Curated OER
2D Grpahing Functions
In this algebra worksheet, 9th graders graph linear equations using a line. They find values for x and y and plot them on a coordinate plane to make a line. There are 6 questions.
Illustrative Mathematics
Two Lines
Here is a resource that helps your algebra learners understand the connection between the graph of two lines, the equations of lines, and the solutions and intersecting points of lines. It would make a great assessment question, but can...
Illustrative Mathematics
Equations of Lines
The intent of this resource is to show algebra learners that there is a proportional relationship between two lines that have an intersecting point. As the coordinate x increases by a constant, the y coordinate also increases. It...
Illustrative Mathematics
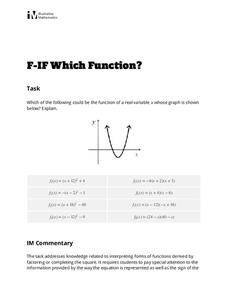
Which Function?
Learners are given a graph of a parabola on a coordinate system, but intercepts and vertex are not labeled. The task is to analyze eight given quadratic functions and determine which ones might possibly be represented by the graph. The...
Curated OER
Functions
In this algebra worksheet, students look at 4 sets of relations and determine if they are functions. Students are provided with the graphs of three functions and determine the function value. Two relations are graphed on the coordinate...
Center of Excellence for Science and Mathematics Education
A Sick Astronaut
Aspiring astronauts graph, interpret, and analyze data. They investigate the relationship between two variables in a problem situation. Using both graphic and symbolic representations they will grasp the concept of line of best fit to...
Curated OER
Introductory Algebra Chapter 8 Review
In this math worksheet, students solve the problems that are correlated with the objectives. Each practice set has an in depth example.
Inside Mathematics
Functions
A function is like a machine that has an input and an output. Challenge scholars to look at the eight given points and determine the two functions that would fit four of the points each — one is linear and the other non-linear. The...
EngageNY
Finding Systems of Inequalities That Describe Triangular and Rectangular Regions
How do you build a polygon from an inequality? An engaging lesson challenges pupils to do just that. Building from the previous lesson in this series, learners write systems of inequalities to model rectangles, triangles, and even...
Inside Mathematics
Picking Apples
Getting the best pick of the apples depends on where to pick. The short assessment presents a situation in which class members must analyze a real-world situation to determine the cost of picking apples. The pricing structures resemble...

