Curated OER
Polynomials
In this worksheet, students solve and complete 32 various types of problems. Included are problems on simplifying polynomials, factoring, graphing equations by plotting points, and simplifying expressions using the rules of...
West Contra Costa Unified School District
Multiple Representations of Equations
class members first work through finding the equation, table of values, graph, and key features of a linear function expressed verbally. Individuals then work through several more problems given different representations.
Curated OER
Your Father
Your learners will explore the idea that not all functions have real numbers as domain and range values as seen in this real-life context. Secondly, the characteristics required for a function to have an inverse are explored including...
Curated OER
Linear Regression and Correlation
Learners explore scatter plots. In this linear regression instructional activity, groups of pupils graph scatter plots and then find the line of best fit. They identify outliers and explain the correlation. Each group summarizes and...
Curated OER
Completing the Square
Solve equations by completing the square. The pupils factor quadratic equations and graph the parabola. They also identify the different terms in the equation and look for patterns.
Curated OER
Finding Patterns and Graphing Functions
Students investigate patters for area and perimeter. In this Algebra I/Geometry lesson, students explore two different patterns as they write a formula for the nth term of each pattern. Students graph their results and determine if the...
Curated OER
Making Connections
Eighth graders investigate the input/output model for building function tables. From the data, 8th graders connect tables, graphs, function rules, and equations in one variable. They work backwards to determine function rules for given...
Curated OER
Exploring Power Functions 1
Learners describe the end behavior of polynomial functions. Pupils relate the behavior of the graph to the exponent of the graph. They differentiate graphs with odd-exponent and graphs with even exponents.
Curated OER
Graph Logarithms
Mathematicians graph logarithmic equations. Teach your students how to identify the intercepts of logarithmic equations and tell whether the function is increasing or decreasing. They find the domain and range of each function.
Curated OER
Domain and Range of Exponential Functions
Have your class find the domain and range for each function. Students graph equations using the TI. They find all the x and y values as they relate to the domain and range.
Texas Instruments
Data Collection for Bar Graphs
Learners study the concept of central tendency in this data collection for bar graph lesson. They collect data outside as instructed and organize it into a bar graphs, then they list in specific groups the labels that appear on the...
Curated OER
Regents High School Examination: Mathematics B
In this algebra, graphing, and geometry exam worksheet, 12th graders complete 34 math problems. The skills for each question cover a variety of topics, and graphing on grid paper is required for some of the questions.
Curated OER
Exploring Graphs of Inequalities
Learn how to solve inequalities and graph their answers. High schoolers use addition, subtraction, multiplication and division to solve problems. They analyze their graph using the TI calculator.
Curated OER
Jeopardy
An unusually challenging Jeopardy-style game is here for your charges. All sorts of high-level algebraic terminology, concepts, and problem solving are embedded in the game. There is even a Final Jeopardy clue. I have found these...
Curated OER
Functions in Motion
Students graph polynomials functions and analyze the end behavior. For this algebra lesson, student differentiate between the different polynomials based on the exponents. They use a TI to help with the graphing.
Curated OER
Algebra I - Test
Pupils participate in a lesson that reviews the concept of linear functions in connection with preparation for an exam. The teacher reviews problems with the students for scaffolding. Pupils practice graphing linear functions.
EngageNY
End-of-Module Assessment Task - Algebra 2 (Module 3)
The last installment of a 35-part series is an assessment task that covers the entire module. It is a summative assessment, giving information on how well pupils understand the concepts in the module.
West Contra Costa Unified School District
Matching Quadratic Functions
Ever sigh when learners ask why they have to know so many different forms of the quadratic equation? Here is a lesson that comes in handy! Using hands-on matching activities, quadratic equations are explored through...
Illustrative Mathematics
As the Wheel Turns
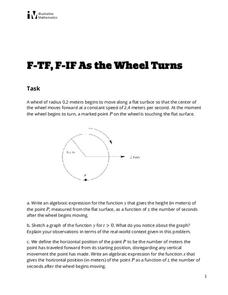
Determine the location of a point on a moving wheel. The task challenges groups to determine the horizontal and vertical locations of a point on the edge of wheel that is moving. Teams first determine a function that will model the...
Illustrative Mathematics
Do Two Points Always Determine a Linear Function?
Your learners can approach this task algebraically, geometrically, or both. They analyze the building of a linear function given two points and expand the concrete approach to the abstract when they are asked to find the general form of...
Curated OER
Do Two Points Always Determine an Exponential Function?
Algebra learners explore, analyze and build an exponential equation given its form and a specific point that exists on the function in this task. The last question asks learners to apply their ideas to an exponential equation given two...
EngageNY
The Graph of the Equation y = f(x)
Math language? Set notation is used in mathematics to communicate a process and that the same process can be represented as computer code. The concept to the loop in computer code models the approach pupils take when creating a solution...
Agile Mind
Transforming Graphs of Quadratic Functions
In the activity on this webpage, learners use interactive graphing technology to investigate transformations of graphs. In the first part of the task, they look at the graph of a quadratic function with coordinates of a few points...
Illustrative Mathematics
Transforming the graph of a function
This activity guides learners through an exploration of common transformations of the graph of a function. Given the graph of a function f(x), students generate the graphs of f(x + c), f(x) + c, and cf(x) for...


