EngageNY
Nature of Solutions of a System of Linear Equations
If at first you cannot graph, substitute. The lesson introduces the substitution method as a way to solve linear systems if the point of intersection is hard to determine from a graph. The 28th installment of a 33-part series finishes...
EngageNY
Linear Models
Expand your pupils' vocabulary! Learn how to use statistical vocabulary regarding linear models. The lesson teaches scholars the appropriate terminology for bivariate data analysis. To complete the module, individuals use linear...
EngageNY
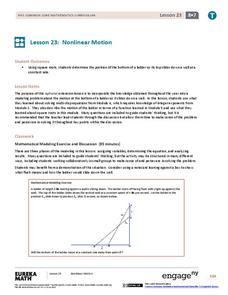
Nonlinear Motion
Investigate nonlinear motion through an analysis using the Pythagorean Theorem. Pupils combine their algebraic and geometric skills in the 24th lesson of this 25-part module. Using the Pythagorean Theorem, scholars collect data on the...
West Contra Costa Unified School District
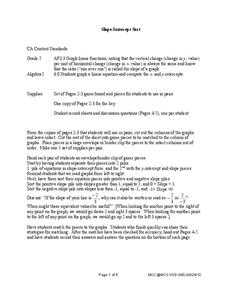
Slope-Intercept Sort
What's so special about slope? Pupils first match cards with slope and y-intercept to graphs of linear equations. They continue the lesson by matching equations in slope-intercept form to the same graphs.
Curated OER
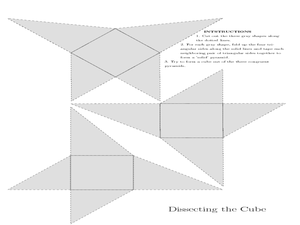
Dissecting the Cube
Young scholars investigate the volume of cones. In this geometry activity, students define the formula to find the volume of cones. They define the concept of having to dissect a three dimensional figure and find the volume.
Curated OER
Measuring Yourself Using the Metric System
Students measure using the metric system. In this geometry lesson plan, students solve problems using grams, meters and liters. They convert between the US units of measurements and the Metric System.
Mathematics Assessment Project
Representing Polynomials
Use this complete and very detailed lesson plan to assess your students' understanding of two important behaviors of polynomials. The first is the relationship between the zeros of a polynomial function and the function's graph, and the...
Curated OER
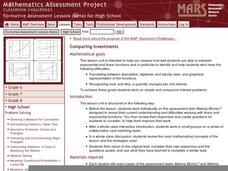
Comparing Investments
Money, money, money. A complete lesson that makes use of different representations of simple and compound interest, including written scenarios, tables, graphs, and equations to highlight similarities and differences between linear and...
Curated OER
Storm Clouds-- Fly over a Late Winter Storm onboard a NASA Earth Observing Satellite
Students study cloud data and weather maps to explore cloud activity. In this cloud data instructional activity students locate latitude and longitude coordinates and determine cloud cover percentages.
PBS
Patterns to the Rescue!
Track down the Cyberchase episode that this lesson plan is associated with. Using a worksheet that is embedded in the plan, learners must find the next two numbers and shapes (a double pattern). Once these have been discovered, pupils...
Curated OER
Stars and Slopes
More of a math lesson than physics or space science, high schoolers take a set of data and plot it on a log-log coordinate system. The write-up for day two was never completed, but day one, "Stars and Slopes," is complex and cohesive....
Curated OER
Matrix Madness!!
Perform operations to add, subtract, multiply and divide matrices. Then solve problems with vectors using matrices. A three day lesson: Matrix Madness, Mystical Matrices, and Decode the Encode. The last lesson has prizes that the class...
Cornell University
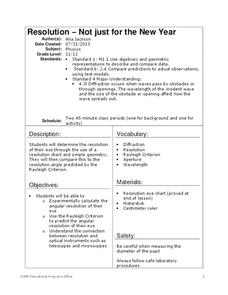
Resolution—Not Just for the New Year
Experiment with optical resolution using an inquiry-based lesson. Young researchers calculate fellow classmates' optical resolutions. They apply the information to understand the inner workings of optical instruments.
Curated OER
Slopes and Linear Equations
Young scholars find the slopes of linear functions. In this graphing lesson, students analyze linear equations and calculate the slope of the line. They graph a line given the slope and y-intercept.
Curated OER
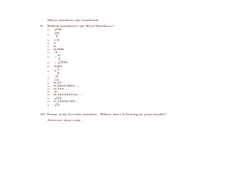
Real Number System Graduated Bowl Activity
Eighth graders determine which numbers are rational numbers. In this number lesson students answer a series of questions related to natural and whole numbers as well as integers and rational numbers. Students work cooperatively in groups.
Curated OER
Using a Multi- Sensory Approach
Students identify the slope of a line given two points on the line. In this algebra lesson, students solve linear equations by finding and comparing slopes of lines. They differentiate between the steepness of the slope and the line.
Curated OER
Estimating With Fire
Students solve problems with percents, decimals and fractions. In this algebra lesson plan, students convert between fractions, percents and decimals. They estimate their answers and calculate their answer.
Curated OER
Decode Word Is..
Students solve problems using patterns. In this algebra lesson, students identify the relation, domain and range of a function. They graph functions using coordinate pairs.
Curated OER
How Far Am I Traveling
Students solve for missing sides using the Pythagorean theorem. In this algebra instructional activity, students derive the six trigonometric values using the right triangle. They relate the Pythagorean theorem to the distance formula.
Curated OER
Don't Let Parabolas Throw You
Students identify relation, function, patterns and range. For this algebra lesson, students factor and graph quadratic equations. They use transformation to move the parabola around and make predictions.
Curated OER
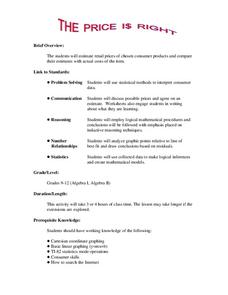
The Price Is Right
Students create a list of products with estimated prices. In this algebra lesson, students learn to write equations using variables. They match their created list with that of actual products and compare their prices,
Curated OER
When Am I Ever Going to Use this?
Young scholars solve problems using equations and properties of integers. In this algebra lesson, students solve problems using ratio and proportion and graph their answers on a coordinate plane. They solve word problems using geometry.
Curated OER
Functions in Motion
Learners graph polynomials functions and analyze the end behavior. In this algebra lesson plan, student differentiate between the different polynomials based on the exponents. They use a TI to help with the graphing.
Curated OER
Relating Distance and Velocity Over Time
Students calculate the distance and velocity over time. In this algebra lesson, students graph a linear function to represent the distance vers time travel. They interpret their graphs and draw conclusion.


