New York State Education Department
US History and Government Examination: June 2010
Just how successful were the reform movements of the ninteenth and twentieth centuries? Using documents ranging from the writings of Mother Jones to the marriage vows of Lucy Stone, individuals consider the question in a scaffolded...
American Battlefield Trust
Civil War Overview: Elementary Lesson Plan
How do you teach the Civil War and all its intricacies within the time limits of an average school day? Using a three-part plan, teachers easily integrate coverage of key Civil War battles into the unit. The lesson includes activities to...
American Battlefield Trust
1864-1865: Bringing the War to an End
The Civil War—in its breathtaking ferocity—came to a close in 1864. However, turmoil echoed throughout the country's politics, including the presidential context between Lincoln and McClellan. Performing chronology and primary source...
Radford University
Curve of Best Fit
Don't watch the resource go down the drain. Scholars perform an experiment where they measure the amount of water that flows from a funnel over time. They use the data to create graphs and find the curves of best fit.
Great Books Foundation
I Shall Not Beg for My Rights
An excerpt from Henry MacNeal Turner's address to the Georgia legislature provides class members with an opportunity to develop their literary analysis skills. Prompted by the provided factual, evaluative, and interpretive questions,...
US Department of Commerce
Census in Counties - Describing and Comparing Histograms to Understand American Life
Use graphs to interpret life in 136 counties. Pupils analyze histograms and describe the shapes of the distributions of data collected from several counties on different aspects of life. Scholars make predictions on the difference in...
US Department of Commerce
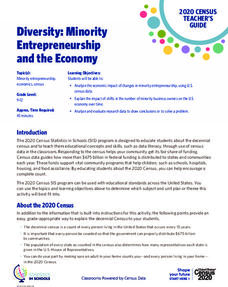
Diversity: Minority Entrepreneurship and the Economy
Using data from the Census Bureau, learners discover the growth in minority-owned businesses over time. After crunching numbers, analytical questions probe the reasons behind the shift.
US Department of Commerce
Featured Activity: Exploring Questions for the 2020 Census
Just what is the census for? Using data and census questions, class members explore how officials gather information. Then, they consider how the government uses the answers to determine how it spends its money with a collaborative...
Center for History Education
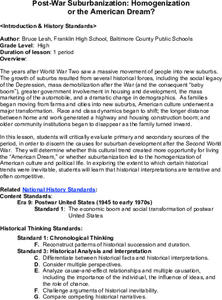
Post-War Suburbanization: Homogenization
The results of World War II made waves all the way to suburban life today. Examine the flight from the cities using images and documents from the 1950s building boom, including a quote analysis and political cartoons. The resource...
Center for History Education
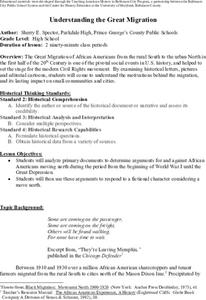
Understanding the Great Migration
What would make someone leave home and travel thousands of miles to find another one? Young historians look at letters, demographic data, and artwork to answer the question for the Great Migration, or the movement of thousands of African...
American Statistical Association
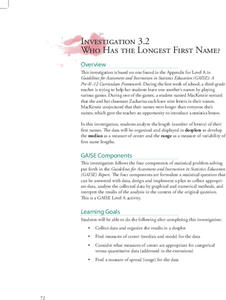
Who Has the Longest First Name?
Name that statistic! Classmates each write their name and the number of letters in it on a sticky note to place on the board. As a class, they determine the median, mode, and range of the name lengths, and create a dot plot of the data....
DocsTeach
Women of Color and the Fight for Women's Suffrage
Introduce young historians to primary source analysis with a lesson that teaches them how to use a four-step process to analyze a photograph of a 1913 Suffrage Parade. Groups practice the process and share their observations with the...
Curated OER
Literary Analysis - The Hobbit
Students write a literary analysis for J.R.R. Tolkien's The Hobbit. In this literary analysis lesson, students review the elements of a literary analysis. Students read the book and take notes for the analysis. Students then write a...
Curated OER
Using Pictographs With Data
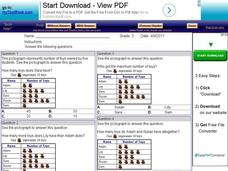
In this using pictographs with data worksheet, 3rd graders read data from a pictograph to answer ten multiple choice questions. Answers can be shown on the screen.
Curated OER
Data Handling: Bus Charts
In this data display and analysis worksheet, students study a bar graph that shows the number of people who ride the bus at different times of day. Students use the graph to solve 6 problems. Note: Bus times are shown in 24 hour clock time.
Curated OER
Literary Response and Analysis
Eighth graders analyze the points of view and complete a literary analysis for The Cayby Theodore Taylor. In this literary analysis lesson plan, 8th graders read the novel and retell the story from Timothy's point of view, the cat's...
Curated OER
Literary Response and Analysis
Ninth graders analyze a work of literature about an author. For this biography analysis lesson, 9th graders research an author and work in groups to discuss the author with other students. Students research and discuss the authors Edgar...
Curated OER
Handling Data/Measures of Average - Finding the Mean from Displayed Data
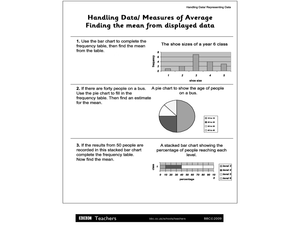
In this mean and average worksheet, students use the bars and charts to help them find the means using the given data. Students solve 3 problems.
Curated OER
Dimensional Analysis
For this mathematics worksheet, students use dimensional analysis to solve each of the problems on the sheet. They convert the measurements to the units indicated. Then, students identify the cost of a kilogram of margarine.
Curated OER
Dollar Data
In this math worksheet, learners examine a dollar bill in great detail. They record the facts in a data table and then give an oral report of the findings.
Curated OER
Literary Analysis- 451 Fahrenheit
Students explore Fahrenheit 451 by Ray Bradbury. For this literature lesson, students locate examples of elements of writing in the text. Students write a literary analysis to include a thesis statement and evidence from the book.
Curated OER
Using Data Loggers
In this weather data worksheet, students use this worksheet to record data about temperature, wind speed, and more. Students complete 18 spaces on the chart.
Curated OER
Data Analysis
In this data analysis worksheet, 9th graders solve and complete 8 different problems. First, they add each of the matrices shown at the top. Then, students subtract the matrices. They also multiply and simplify the given expression.
Curated OER
wordsnake- Word Puzzle- Data
In this wordsnake puzzle worksheet, students locate words that are associated with data. They start at an arrow on the page, and work their way across and down, but not diagonally, through a grid. They locate one word attached to another...
Other popular searches
- Data Analysis
- Literary Analysis
- Character Analysis
- Poetry Analysis
- Data
- Data, Census, & Statistics
- Character Sketch
- Word Analysis
- Analyzing Poetry
- Thinking Analysis
- Dimensional Analysis
- Analysis Song Lyrics


