Curated OER
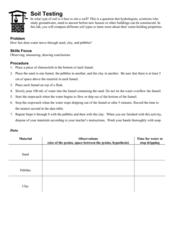
Soil Testing
Earth science learners experiment with the water-holding properties of sand, pebbles, and clay. They apply their findings to the building of a well. This activity is engaging and tactile, and it demonstrates the importance of considering...
Georgia Department of Education
Math Class
Young analysts use real (provided) data from a class's test scores to practice using statistical tools. Not only do learners calculate measures of center and spread (including mean, median, deviation, and IQ range), but...
Statistics Education Web
Are Female Hurricanes Deadlier than Male Hurricanes?
The battle of the sexes? Scholars first examine data on hurricane-related deaths and create graphical displays. They then use the data and displays to consider whether hurricanes with female names result in more deaths than hurricanes...
Howard Hughes Medical Institute
Lesson 8: WildCam Gorongosa Data Analysis
How do scientists analyze data to get a specific answer to a question? The final chapter in an eight-part series of activities centered around Gorongosa National Park encourages scholars to dig deeper into the scientific process. After...
Encyclopedia Britannica
Campaign Photo Analysis
It's the art of the image! As part of a study of the 2020 Presidential race, groups analyze an image of a candidate, first from an objective point of view and then subjectively. They then prepare a presentation detailing what they...
PBS
Student Helioviewer Data Tool
Scholars use current satellite data to view solar events, solar features, and so much more. It allows them to make videos over time to observe patterns and visually understand the sun at a much higher level using the interactive that is...
DocsTeach
Patent Analysis: Joseph Glidden's Barbed Wire
Barbed wire may have made cattle farming easier, but it brought to an end the free-roaming days of the plains. No longer could Native American groups continue their nomadic lifestyle, and the days of cowboys herding large groups of...
Curated OER
Literary Analysis of The Minister's Black Veil
After reading The Minister's Black Veil, by Nathaniel Hawthorne as a homework assignment your class will complete a literary analysis. Learners will analyze important element of the story and take notes to help support their...
Curated OER
Writing a Literary Analysis
What makes writing literary? What comprises analysis? A 15-slide PowerPoint presentation, created by the Purdue University Writing Lab, tackles these questions. The explanations of what makes writing literary and what comprises analysis...
Curated OER
Graphs to Represent a Data Set
By analyzing a word problem about hours worked in a week, scholars get valuable practice with bar graphs and data analysis. They read the scenario, then examine a table of data taken from it. The data includes four days and the...
Curated OER
Graphs and Data
Pupils investigate poverty using graphs. In this algebra lesson, students collect data on the effects of poverty and use different rules to analyze the data. They graph and use the trapezoid rule to interpret the data.
Curated OER
Graphs to Represent a Data Set
How many animals did Chaplin see at the zoo? Scholars examine three data sets and create a bar graph for each. Encourage them to label the different parts of their graphs, as this is not prompted on the worksheet. Once they finish their...
Curated OER
Using Computer for Statistical Analysis
Learners use the computer and S'COOL data for statistical analysis.
Curated OER
"Data Dabble"
Students engage in a lesson which facilitates their use of web sites to find data, graph it, and interpret it, thus scaffolding graphing skills to prepare students for their 8th grade I-search exit project.
Curated OER
Primary Source Analysis Worksheet
In this Colonial America primary source analysis worksheet, reviewers respond to 5 short answer questions. Although the primary source documents are not included, the questions could be adapted to the analysis of any primary source.
Curated OER
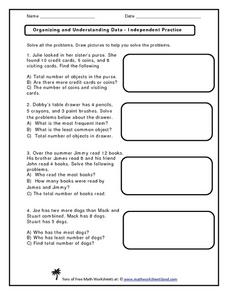
Organizing and Understanding Data - Independent Practice
Provide your first graders with an opportunity for independent practice organizing and understanding data. The ten story prompts on this three-page worksheet asks learners to solve problems involving concepts of the total number of...
Curated OER
Generate Measurement Data Word Problems
Bar and line graphs are an excellent way to visually analyze data: give your scholars practice both analyzing graphs and creating their own! First, they examine five basic bar graphs, indicating the number of squares on specific days....
Curated OER
Generate Measurement Data Word Problems
Beginning graphers will appreciate this practice with basic bar graphs. For each table of data, there is a corresponding graph for learners to match it to. The five data sets all have the same two...
Curated OER
Graphs that Represent Data Sets
Use these pre-made data sets to introduce kids to bar graphs and data analysis, and then have them take surveys on their own. There are 10 survey scenarios written out here, and scholars synthesize the results of each into a bar graph....
Curated OER
Interpreting Graphs and Analyzing Data
Students investigate graphs and analyze the data displayed in the graph. They read a graph reflecting the birthday data for the students to read and analyze. Students use the graph to determine the number of birthday cards they need to...
Curated OER
Sweet Data
Students input data about the colors of their serving of M&M candies onto a spreadsheet. They create charts and graphs based on this information.
Curated OER
Graphs to Represent a Data Set
Here are a some pre-made sets of data that kids can use to practice data analysis. There are 10 survey scenarios written out, and scholars synthesize the results of each into a bar graph. In addition to the graphing, they answer two...
Curated OER
Literary Response and Analysis
Students analyze the archetype of 'the fall' in Shakespeare's Macbeth. In this literary analysis lesson, students work in tiered learning groups to analyze the characters of Macbeth and Lady Macbeth. Students use the book of Genesis as...
Curated OER
Data Analysis: For Little Learners
Using pictographs, tally charts, and surveys, kids learn all about data analysis and collection. They make surveys, collect data, then construct pictographs and tally charts to organize their information.
Other popular searches
- Data Analysis
- Literary Analysis
- Character Analysis
- Poetry Analysis
- Data
- Data, Census, & Statistics
- Character Sketch
- Word Analysis
- Analyzing Poetry
- Thinking Analysis
- Dimensional Analysis
- Analysis Song Lyrics


