Curated OER
Native Americans of the Chesapeake Bay: Using Primary vs. Secondary Sources
Discover the rich Native American culture that existed at the time of early European exploration into the Chesapeake region through analysis of several primary and secondary sources.
Curated OER
Food and Languages of the World
Students listen to the story "No Blue Food" in this lesson. They then discuss Allegra, the main character, and her hesitation to try new foods. They participate in a matching game in which they match cards to determine a fruit topping...
Curated OER
Foods and Languages of the World
Young scholars review Mexico's location and language and learn to pronouns 10 new Spanish food words. Students listen as the book, Corn is Maize is read, touching and passing around an ear of Indian corn. Young scholars discuss the...
Albert Shanker Institute
Economic Causes of the March on Washington
Money can't buy happiness, but it can put food on the table and pay the bills. The first of a five-lesson unit teaches pupils about the unemployment rate in 1963 and its relationship with the March on Washington. They learn how to create...
Curated OER
Food Safety Lab-Part 3 Cross Contamination andHygiene
Students observe the effect of croos contamination as they inoculate orange juice with penicillin mold from the refrigeration lab and active yeast solution from the sterilization lab. They experience a simulation of passing bacteria...
Curated OER
Food or Not Food?
In this food worksheet, students analyze 12 drawings of different objects, some of which are food and some are not. Each object has a number next to it. Students put the number in the Food column if the object is food. They put the...
Curated OER
Bell Curve
Students explore averages by completing a data analysis activity. In this bell curve lesson, students measure different food items and plot their measurements on a X and Y axis. Students create bell curves around the average weight or...
Curated OER
Observation Milk Fat Lesson
Turn your class loose to experiment with the different fat content in skim milk, whole milk, half and half, and heavy cream. This is a visually vibrant experiment, as learners drip food coloring on the surface of the products and measure...
University of Georgia
The Power of Peanuts
Measure the amount of energy in a peanut by igniting a chemical reaction. Classes use a laboratory setup to burn a peanut and measure the amount of heat it releases through a temperature analysis. They calculate the number of Joules of...
Curated OER
Cyber Chow Combos
Using a worksheet that's embedded in the plan, elementary schoolers must come up with the most possible combinations of food they can order from the menu on the worksheet. The activity is meant to be done independently by everyone, then...
NOAA
Through Robot Eyes
How do robots assist ocean explorers in collecting data and images? The final installment in a five-part series has science scholars examine underwater images collected by robots and identify the organisms shown. Groups then calculate...
Curated OER
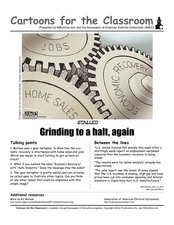
Cartoons for the Classroom: Grinding to a Halt- The U.S. Economy
Using gears as a visual metaphor, this political cartoon analysis worksheet gives a clear picture of one artist's perspective on the U.S. economy. Background information helps give pupils access to the cartoon's context, and 3 talking...
American Chemical Society
Defining Dissolving
Physical science investigators mix sugar and food coloring into different cups of water and cooking oil to compare how the solid and liquid behave in each. As the introduction to this unit on dissolving, it is relevant.
Curated OER
What We Eat, Where We Sleep: Documenting Daily Life to Tell Stories
This is not just a New York Time article to read, this is a set of amazing activity ideas all related to the slide shows "Breaking Bread Everywhere" and "Where Children Sleep." Your class can view each show, read about what they mean...
Media Smarts
Selling Obesity
Learners examine health issues that are associated with our fast food culture, and the advertising of it. They begin with a snack-food survey to assess their own eating habits. Pupils are encouraged to think critically throughout the...
Centers for Disease Control and Prevention
Poisoned Picnic
A group of teachers attended a picnic; ten became sick and another four died. Young scholars must solve the mystery of what happened. They research the river, waste water treatment plant, each food that was served, and environmental...
Cheetah Outreach
Population Change
Your youngsters become cheetahs in search of food, water, shelter, and space in a fun physical game that does a fantastic job of representing fluctuating species population based on resources available over years.
American Psychological Association
A Tasty Sample(r): Teaching about Sampling Using M&M’s
Here's a sweet activity! As part of a study of psychological research methods and statistic gathering, individuals develop a hypothesis about the number of each color of M&Ms in a fun-size package. They then count the number of each...
Humanities Texas
A President's Vision: Franklin D. Roosevelt
This poster goes well beyond any traditional worksheet in allowing learners to analyze a variety of primary source documents related to the presidency of Franklin D. Roosevelt.
Curated OER
Big Dam Construction in India
This complete and full resource includes everything needed to conduct a lesson on the environmental impact of large dams in India. Background information, handouts, answer keys, and web links are all there to help you educate your class...
Humanities Texas
A President's Vision: Lyndon Baines Johnson
Learners take a closer look at the presidency of Lyndon B. Johnson, including the Great Society and the passage of the Voting Rights Act, through image analysis and primary source worksheets.
Curated OER
Blast the Fats
Students examine the fats found in foods. In this nutrition lesson, students identify the types and amounts of fats found in foods as they research food labels and the Internet. Students classify the fats and record their data.
Curated OER
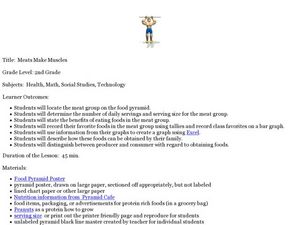
Meats Make Muscles
Second graders explore the meat group of the food pyramid. In this nutrition and diet lesson, 2nd graders study the benefits of eating foods in the meat group, collect data regarding their classmates' favorite foods, and create a graph...
Curated OER
Tracking Ocean Ecology
Students look at the data maps given to them about how chlorophyll affects the algae blooms and make predictions about the harm they will cause. In this data maps lesson plan, students manipulate data sets from the website.
Other popular searches
- Cost/benefit Analysis Food
- Food Label Analysis
- Food Analysis
- Food Drive Data
- Cost Analysis Food Service
- Dog Food Analysis


