Curated OER
TV Programme Times
In this schedule worksheet, students analyze the beginning or ending times of 8 children's TV shows. Students complete a chart in which they fill in the missing times or duration of the shows. Note: This page is from the UK and the shows...
Curated OER
TV Survey - Data Collection and Analysis
In this data collection and analysis worksheet, 4th graders complete a tally chart about the number of hours that fourth graders watch television. They create a bar graph with the information, write a paragraph about the survey results,...
Curated OER
NUMB3RS Activity: Where’s the Source? Episode: “Undercurrents”
Several real-world problems are posed as a way to learn about vector fields in order to make some predictions after analyzing the data. The main problem comes from the tv show NUMB3RS and is based on solving a crime where a body has...
Curated OER
Television: Comedy Vs. Drama
Students investigate the world of Television by contrasting specific programs. In this visual storytelling lesson, students compare and contrast the differences between comedy and drama by making a Venn Diagram. Students...
EngageNY
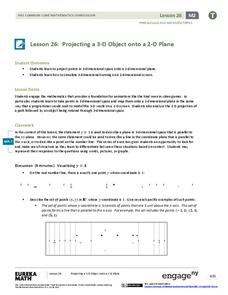
Projecting a 3-D Object onto a 2-D Plane
Teach how graphic designers can use mathematics to represent three-dimensional movement on a two-dimensional television surface. Pupils use matrices, vectors, and transformations to model rotational movement. Their exploration involves...
Curated OER
Econ in a Bag
Here is a nice idea, have your young entrepeneurs form their own companies. Each company is given a paper bad to locate and place resources in that they can use to create products their businesses sell on Sale Day. They identify and...
Curated OER
Scattered About
Students are introduced to the concept of scatter plots after reviewing the various types of graphs. In groups, they analyze the type of information one can receive from a scatter plot and identify the relationship between the x and y...
Curated OER
The Spider and the Fly
Students investigate maxima and minima by finding the shortest distance. For this calculus lesson, students calculate the shortest distance a bug travels to get to the other side of the tv. They analyze their findings discussing...
Curated OER
Taking Poll Information
Students investigate the election and poll surveys. In this statistics lesson, students take poll information and analyze the data. They graph their data and make predictions and conjectures.
Curated OER
Chart This!
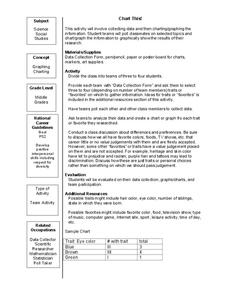
Students collect and analyze data. In this middle school mathematics lesson, students collect data on three to four traits or favorites. Students analyze their data and create a chart of graph for each trait or favorite they...
Curated OER
TOPSY TURVY MAPS
Eighth graders use the data analyzer and motion detector to collect data and measure distances. They create topographic maps drawn to scale of a given setup and relate the concepts to the creation of historical ocean maps.
Curated OER
Probability With a Random Drawing
Students define probability, and predict, record, and discuss outcomes from a random drawing, then identify most likely and least likely outcomes. They conduct a random drawing, record the data on a data chart, analyze the data, and...
Curated OER
Cold Enough?
Students read and record temperatures and display the data. They represent the temperatures on an appropriate graph and explain completely what was done and why it was done. Students display the data showing differences in the daily...
Curated OER
Plan a Schedule
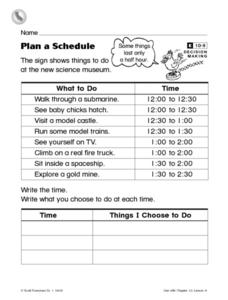
In this daily schedule worksheet, students analyze a chart that shows a schedule for events at a museum. Students plan a visit by making a schedule of events they would like in their own schedule.
Curated OER
Exercise Those Statistics!
Young scholars participate in various activities, measuring their pulse rates and recording the data. They analyze the statistical concepts of mean, median, mode, and histograms using the data from the cardiovascular activities.
Curated OER
Graphs
Eighth graders analyze graphs on a worksheet and in newspapers and magazines. In this graphs lesson plan, 8th graders also record their thoughts in a journal.
Curated OER
Adding and Subtracting Bears and Goats
First graders evaluate math problems using farm animals. For this consumer math lesson, 1st graders discover math problems which concern quantities of farm animals. Students discover new strategies to help them analyze their...
Curated OER
Basketball: Number Sense
Third graders explore their addition and subtraction skills. In this number sense lesson, 3rd graders analyze different scoring possibilities for a basketball game. This lesson incorporates the use a video titled "Blossom and...
Curated OER
Chart This!
Students collect data and graph or chart the information. In this data organization lesson, students poll their classmates about certain topics and chart or graph the information to show the results of their research.
Curated OER
Rescue the Pattern
Students describe a wide variety of patterns. They extend a wide variety of patterns. Students write rules for a wide variety of patterns. Students represent, analyze, and generalize a variety of patterns with tables, graphs, and words.
Curated OER
What Time Is It?
In this ESL telling time learning exercise, students analyze 7 pictures that show clocks and times to the nearest 5 minutes. On the line provided, students write the time in words.
Curated OER
Scatter-Brained
Seventh graders graph ordered pairs on a coordinate plane. They create a scatterplot. Additionally, they determine the line of best fit and investigate the slope of the line. Multiple resources are provided. An excellent resource!
Kenan Fellows
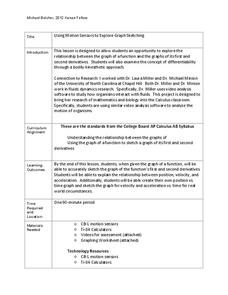
Using Motion Sensors to Explore Graph Sketching
Get moving to a better understanding of graphs of derivatives. Using motion sensors, scholars vary their velocities to create graphs of the first derivative of a function. The activity challenges groups to first create a script of the...
Curated OER
Data Analysis
Twelfth graders collect and analyze data. In this secondary end-of-course mathematics lesson, 12th graders formulate a question they would like to answer and decide on an appropriate means of data collection. Students...


