Curated OER
Fairy Tales
Sixth graders explore the elements of fairy tales. For this fairy tales lesson, 6th graders analyze several versions of Cinderella from around the world. Students graph fairy tale elements using Excel and create Venn diagrams comparing...
Eastconn
Learning to Analyze Political Cartoons with Lincoln as a Case Study
Discover the five main elements political cartoonists use—symbolism, captioning and labels, analogy, irony, and exaggeration—to convey their point of view.
Curated OER
Young Voters Make A Difference
Students research recent statistics on voting by those 18 to 24. They survey senior students to determine their intent to vote in the next election. Students display the data in charts and graphs. They write the results and share it with...
Curated OER
Graph and Compare the Adventure's Temperature Vs. Local Temperature
Learners explore the concept graphing data. In this graphing data lesson, students use weather data from their local weather and some other city and graph them. Learners plot the local weather vs. another city. Students record...
Curated OER
M&M Graphing and Probability
Students create a variety of graphs. They count, sort, and classify M&M's by color and record data on a chart. They use data from the chart to create pictographs, bar graphs and circle graphs. They analyze data and determine...
Curated OER
Analyzing My Path to Success
Seventh graders review their graphs from the previous lesson about trends. Individually, they identify their personal strengths and weaknesses when it comes to being successful. To end the lesson, they use this information to write a...
Curated OER
Maps, Charts, and Graphs
Students define key geographic terms and track a hurricane on a map. They examine various types of maps and find locations on them,including rivers, cities and mountains.
Curated OER
A Look at Race in America Using Statistics
Eleventh graders explore the issue of racism in America. In this American History lesson, 11th graders analyze charts and graphs on blacks and whites in America.
Curated OER
Timed Multiplication Test Graphs
Students use the tools of data analysis for managing information. They solve problems by generating, collecting, organizing, displaying histograms on bar graphs, circle graphs, line graphs, pictographs and charts. Students determine...
Curated OER
Meet The Graphs
Students identify two types of graphs. They analyze and interpret authentic data shown in bar and pie graphs and complete a graph given specific data. Perform simple functions within an Excel document:
Curated OER
Investigating: Interpreting Graphs and Analyzing Data
Students explore statistics by researching class birthday data. In this data analysis lesson, students investigate the different birthdays among their classmates and create data tables based on the given information. Students view bar...
Curated OER
James and the Giant Peach Plot Analysis
It's all about the plot, main events, and story mapping with this lesson. As the class reads the novel James and the Giant Peach, they create an excitement graph that actually charts key events and moments of excitement. After...
American Statistical Association
Scatter It! (Predict Billy’s Height)
How do doctors predict a child's future height? Scholars use one case study to determine the height of a child two years into the future. They graph the given data, determine the line of best fit, and use that to estimate the height in...
Curated OER
Re-Presenting Race in the Digital Age
Teen-aged scientists analyze a graphic organizer of how trash is removed from New York City and then answer standard questions about a graph and a diagram. Resources are mentioned, but there are no links to these resources, so you will...
Curated OER
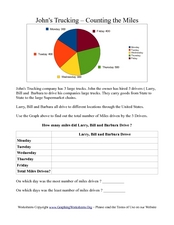
John's Trucking- Counting the Miles
In this graphs instructional activity, students analyze a pie graph showing miles driven by three truck drivers in a week. Students fill out a chart in which they calculate total miles driven.
Curated OER
Graphing Favorite Holidays
Young scholars create spreadsheets and bar graphs based on results of survey of favorite holidays.
Curated OER
Lines of Best Fit
High schoolers determine if there is an associationm in a scatter plot of data. They analyze data through predictios, comparisons, and applications. Students calculate the line of best fit using a graphing calculator. They display data...
North Carolina State University
Exploring Genetics Across the Middle School Science and Math Curricula
Where is a geneticist's favorite place to swim? A gene pool. Young geneticists complete hands-on activities, experiments, and real-world problem solving throughout the unit. With extra focus on dominant and recessive genes, Punnett...
Curated OER
Twelve Days of Christmas
Young scholars create charts and graphs using a spreadsheet. They chart the number of each gift given day by day from the song, "The Twelve Days of Christmas." They create a bar graph and a circle graph from their data on the spreadsheet.
Curated OER
Tracking the Wild Ones
Students apply mathematic skills to discover the extent of the concern for endangered species. Students analyze graphs and look for trends in graphed results of endangered species on a global level.
Curated OER
The Way to Better Grades!
Pupils collect and analyze data. In this statistics lesson, learners create a scatter plot from their collected data. They use, tables and graphs to analyze the data and mae decisions.
Columbus City Schools
Totally Tides
Surf's up, big kahunas! How do surfers know when the big waves will appear? They use science! Over the course of five days, dive in to the inner workings of tidal waves and learn to predict sea levels with the moon as your guide.
ProCon
Gun Control
According to some estimates, there are more guns than people in the United States. Learners decide if America should enact more gun control laws. They analyze information about gun deaths in the United States by year, read about the...
NASA
Comparing Temperature and Solar Radiation for Common Latitudes
There's snow much to learn! Excited individuals use real-world data to discover how latitude affects the odds of a snow day. Scientists compare latitude, solar radiation, and temperature using NASA data for several locations....


