Hi, what do you want to do?
Texas Education Agency
Texas Gateway: Evaluating Data in Tables, Graphs and Charts
[Accessible by TX Educators. Free Registration/Login Required] In this lesson students look at examples of graphics, tables, charts, and graphs, and learn how to interpret their data. They will be able to use this skill to enhance their...
E-learning for Kids
E Learning for Kids: Math: Tea Store: Data and Graphs
Play games by exploring how to interpret bar graphs and organize data in a table.
Texas Education Agency
Texas Gateway: Scientific Investigation and Reasoning Data Organization
Using interactive exercises, students will review how to construct tables and graphs in order to organize data.
Mangahigh
Mangahigh: Data: Trend Graphs
Students explore the concept of frequency trend graphs by working through an online tutorial and then attempting a ten question quiz that increases in difficulty as questions are answered correctly.
Government of Alberta
Learn Alberta: Math Interactives: Exploring Election Data
Using actual Alberta provincial election results, students have the opportunity to interpret election data using a variety of graph types. Pictographs, line graphs, bar graphs, circle graphs, and data tables are covered in this...
Yale University
Yale University: Categorical Data Examples
Site provides some different examples of categorical data and discusses the use of two-way tables.
Texas Education Agency
Texas Gateway: Data Analysis
Given laboratory investigation data in the form of tables, charts, and graphs, students will analyze and predict trends from the data.
Government of Alberta
Learn Alberta: Math Interactives: Exploring Data Display and Graphs
This multimedia Learn Alberta math resource focuses on graphing data. In the video portion, students will see how math is involved in the display of merchandise in stores. The accompanying interactive component provides an exploration...
National Council of Teachers of Mathematics
The Math Forum: Growth Creature Lab Data Collecting
Lesson plan completely explains how students will collect data on the growth of an "alligator" and determine the relationship of the growth data to the Fundamental Theorem of Similarity and to topics in geometry in general. All of the...
Read Works
Read Works:north America:comparing Data From Different Countries Around the World
[Free Registration/Login Required] A chart with land and population data from Canada, the United States of America, the United Kingdom, and Japan. A question sheet is available to help students build skills in reading comprehension.
Beacon Learning Center
Beacon Learning Center: Interpreting Line Graphs
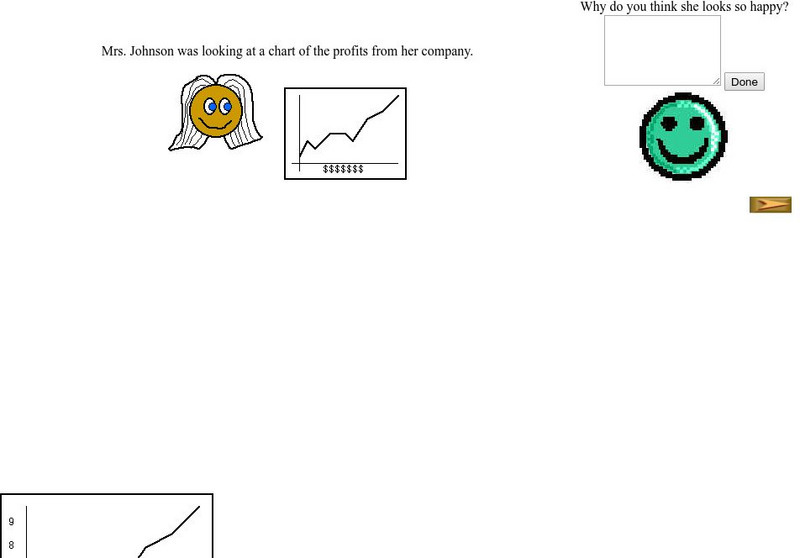
This site is a lesson on creating and interpreting a line graph. It explains how a line graph is created and then asks questions about what is learned from the data. Students type in open responses, and answers and feedback follow.
Science Education Resource Center at Carleton College
Serc: Lab 3: Discovering Local Data
An investigation that is part of a series of lab lessons that expose students to Earth Systems through research, data, and visulazations. This lab specifically has students using a database to gather and graph data to understand the role...
Other
Honolulu Hi 5: Cool Maps With Awesome Weather Data Across 1,219 Us Cities
Explore the weather in states and cities across the United States. Two maps with accompanying graphs are provided. The first indicates the number of comfortably warm summer days a place has and the second shows the temperature and how...
Khan Academy
Khan Academy: Storing Data in Variables
Practice variable assignment in the AP CSP pseudocode, in this set of free practice questions designed for AP Computer Science Principles students.
Khan Academy
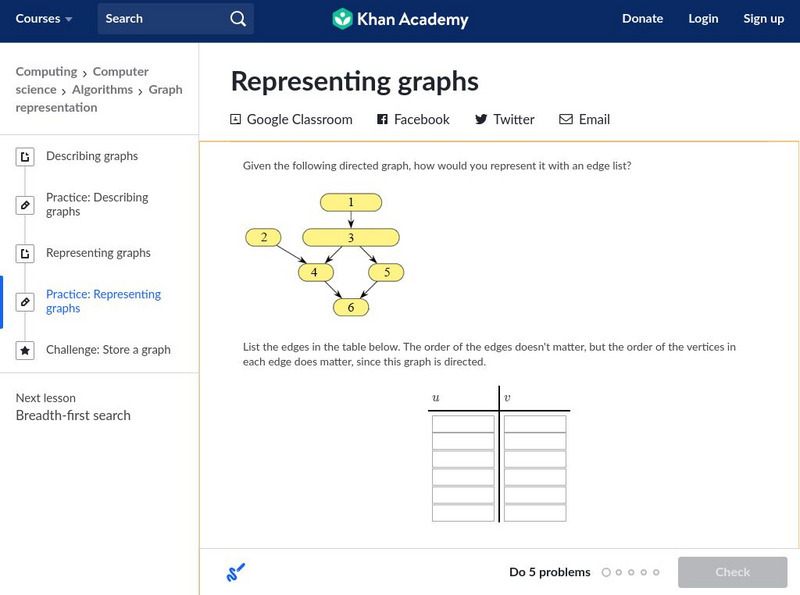
Khan Academy: Representing Graphs
Some practice problems with data and graph representation in computer science.
Sophia Learning
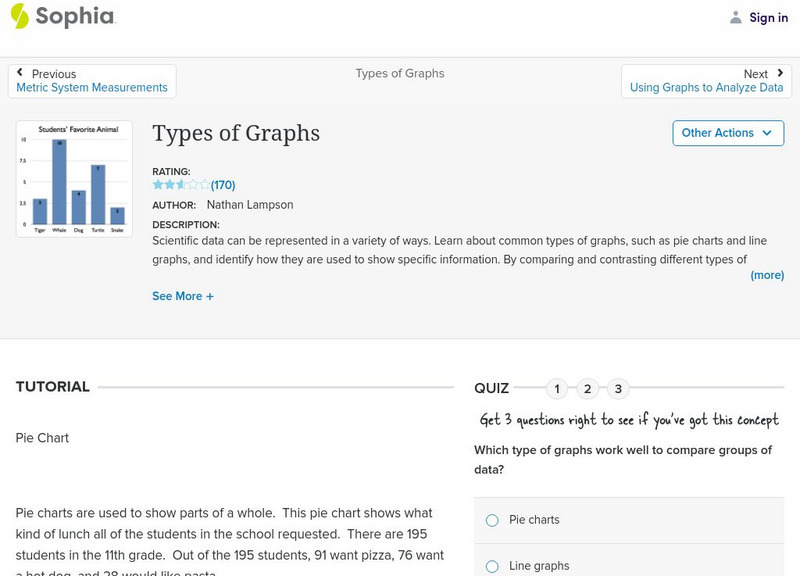
Sophia: Types of Graphs
This presentation allows the learner to visualize the different types of graphs used to display data in scientific investigations.
Texas Instruments
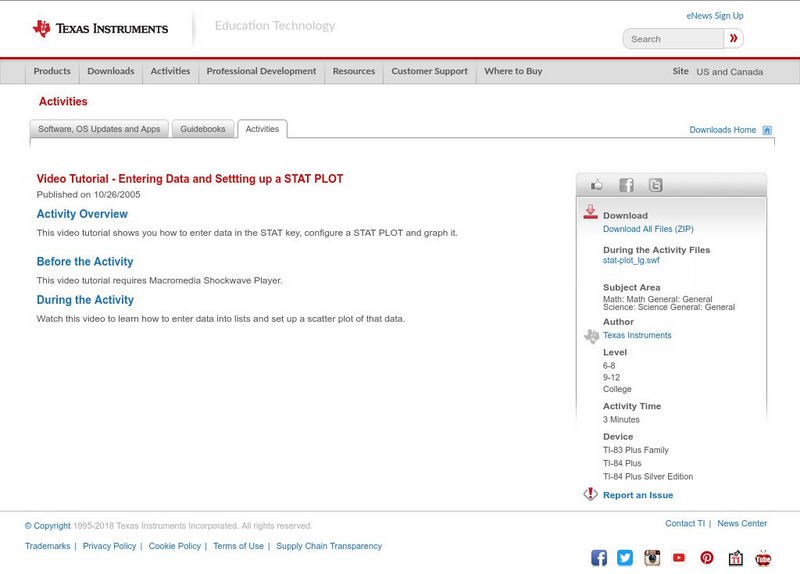
Texas Instruments: Video Tutorial Entering Data and Settting Up a Stat Plot
This video tutorial shows you how to enter data in the STAT key, configure a STAT PLOT and graph it.
E-learning for Kids
E Learning for Kids: Math: Pizza (Italian) Restaurant: Data and Chance
In this interactive site, students practice with bar and picture graphs by helping a pizza place collect and analyze their data.
Oswego City School District
Regents Exam Prep Center: Practice With Organizing and Interpreting Data
Several problems are presented to test your skills in creating and interpreting frequency tables, pie charts, box-and-whisker and stem-and-leaf plots.
BBC
Bbc: Representing Data
This BBC Math Bite tutorial for line graphs, pictograms, and frequency polygons features an exam in which students draw and interpret statistical diagrams.
ArtsNow
Arts Now Learning: We Are Living Graphs and Data [Pdf]
In this lesson, 3rd graders use their own bodies to create bar graphs and do problems involving addition, subtraction, and more or less amounts. They then create their own graphs, incorporating the features of graphs that they have...
E-learning for Kids
E Learning for Kids: Math: Traditional African Village: Bar Graph and Data
Help Kyan make a bar graph with the ages of the children in his village.
Mangahigh
Mangahigh: Data: Record Results
Students explore the concept of recording data by working through an online tutorial and then attempting a ten question quiz that increases in difficulty as questions are answered correctly.
Better Lesson
Better Lesson: Graph Party
First graders will be involved in creating three different types of graphs and then be asked to answer questions about each representations data set.











![Arts Now Learning: We Are Living Graphs and Data [Pdf] Lesson Plan Arts Now Learning: We Are Living Graphs and Data [Pdf] Lesson Plan](https://static.lp.lexp.cloud/images/attachment_defaults/resource/large/FPO-knovation.png)

