EngageNY
Probability Distribution of a Discrete Random Variable
Learn how to analyze probability distributions. The sixth installment of a 21-part module teaches pupils to use probability distributions to determine the long-run behavior of a discrete random variable. They create graphs of probability...
PBS
Analyzing Light Curves of Transiting Exoplanets
Scientists detected exoplanets by measuring how the brightness of stars changed over time. Young astronomers interpret and analyze the same data that led to exoplanet discoveries. They learn to apply light curve graphs and connect the...
STEM for Teachers
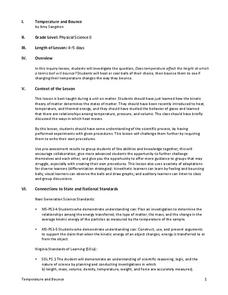
Temperature and Bounce
Take part in a fun experiment and hold an impromptu bouncing contest with your class. Young scientists heat and cool balls before bouncing them to determine whether temperature changes affect how they bounce. The set of...
Curated OER
Froot Loops to the Max - Predictions and Weighing
In this prediction and weighing worksheet, middle schoolers complete and solve 5 problems related to a box of Froot Loops cereal. First, they complete the table with the data each team finds with their box of cereal. Students determine...
Curated OER
Data Shuffle
Students find an advertisement or newspaper using charts or graphs. They create another graph using the same information in a different format. They write a comparison of the two graphs.
Curated OER
Graphs
Students graph ordered pairs to model the relationship between numbers. After observing the patterns in ordered pairs, they describe the relationship, and create graphs from a data table. Students describe intervals in the graph, and...
Curated OER
A New Phase In Town
Middle schoolers explore heat energy and how it is used to change the phase of matter, and discover that temperature does not increase or decrease until the phase change is complete. This extremely well-written plan is packed with great...
Curated OER
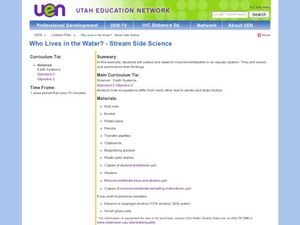
Who Lives in the Water? Stream Side Science
Andree Walker thought of everything when he wrote this resource. It includes a detailed list of materials and background information links for the teacher. In addition, it has procedures, a macroinvertebrate identification key, and tally...
Curated OER
Analysis of the Concentration of Sodium Chloride in a Product
Students design an experiment to test for the concentration of chloride in products. In this analysis of chloride concentration lesson plan, students develop and conduct an experiment to find the amount of chloride ion in a substance of...
Curated OER
Lab Experiments in Nutrition
Looking for authentic hands-on nutritional experiments? High schoolers will perform experiments to test for the presence of vitamin C in several solutions as well as the effect of caffeine on Daphnia. They will also consider the...
Curated OER
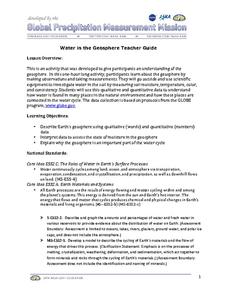
Water in the Geosphere
Through a PowerPoint presentation and the embedded animation and video, earth science enthusiasts find out about the moisture in the soil beneath our feet. In the animation, follow a water molecule on its path through the water cycle. As...
Physics Classroom
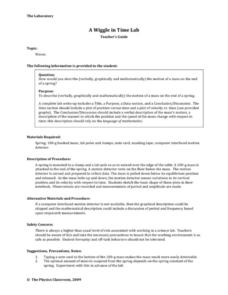
A Wiggle in Time Lab
Though an alternative method is suggested, the best way to carry out this investigation is with the use of a computer-interfaced motion detector. Physics fanatics hang a mass on the end of a spring and analyze its motion verbally,...
Curated OER
Class Birthday Graph
Students analyze the basics of an Excel spreadsheet. They highlight cells in a spreadsheet. They make a column graph. Students are introduced to X-axis and Y-axis. They play various address games on the spreadsheet.
Rainforest Alliance
Climate Educator Guide
Climate change is a hot topic in the news. Class members examine carbon dioxide data to analyze trends of our atmospheric makeup over time. They also discuss climate and climate change, and determine how these changes are affecting life...
American Chemical Society
Evaporation
This is one in several lessons that explore the relationship between temperature and phase changes of water. After some discussion, elementary physical scientists place wet paper toweling on a hot and a room-temperature water bag...
Curated OER
Using Computers to Produce Spreadsheets and Bar Graphs
Students review graphing terminology and how to plot data points, how to input data into a spreadsheet, and how to make a chart using a computer.
Curated OER
Simple Bar Graphs Using Excel
Students create original survey questions, and develop a bar graph of the data on paper. They input the survey data using two variables onto an Excel bar graph spreadsheet.
Curated OER
Jellybean Graphs
Second graders predict and graph data based on the color of jelly beans they think are in a handful. In this prediction lesson plan, 2nd graders will predict how many of each color jellybean are in a handful. Then they graph these...
Curated OER
Ocean Temperatures
Students list data collected by marine buoys and the different kinds of moored buoys. They describe how data is transmitted worldwide. They explain the difference between near shore and offshore air and water temperatures.
Curated OER
Creating Line Graphs
Young scholars relate data to coordinate graphs and plot points on this graph. They use minimum wage data to construct the graph. Students decide appropriate time intervals for the graphs. They share graphs with their classmates.
Curated OER
Plastic Packaging
Students collect data. In this math instructional activity, students collect data about recyclable materials. Students develop a plan that will help the environment. Recycling plastic containers is discussed.
Curated OER
Statistical Pictures of School and Life
Students explore how mathematical data is used to summarize and illustrate everyday life. They apply mathematical concepts and skills to analyze data. Students conduct a five question survey of 50 people or more and graph the data.
Curated OER
Our Favorites
Pupils participate in and conduct a survey to determine various class favorites. They collect, organize and display their data, interpret the results, and complete a packet of worksheets to display the information.
Curated OER
Mapping River Statistics
High schoolers research different statistics to do with the Mississippi River. They answer questions about finding data and collect it by conducting research. The research is used to construct a data table. Then students use the table to...


