Curated OER
Parachute Drop
Learners will have fun creating a parachute to collect data with. They will construct the parachute in small groups, measure the materials, and create an observation sheet. Then they drop the parachute and make predictions about how long...
Curated OER
Analyzing Tree Rings to Determine Climate Change
Students examine how to locate and access data sets. In this climate change activity students import data into Excel and graph it.
Curated OER
Busted Bubbles
Using the scientific method, and bubble gum, learners conduct a motivating experiment. After conducting a series of tests involving bubble gum, they graph and analyze their results. This is the type of activity everyone loves.
Science 4 Inquiry
At the Top: A Bald Eagle's Diet
Bald eagles are opportunistic predators and eat fish as well as raccoons and other mammals. Pupils learn about bald eagle diets through a simple simulation and videos. They collect and analyze data to understand the adaptability of this...
Curated OER
Is Grandpa Right, Were Winters Colder When He Was a Boy?
Students compare current weather data to historic data to see if there is a temperature change. In this weather lesson students complete a lab activity and determine average changes in temperature, precipitation and cloud cover.
Curated OER
Is Portland, Oregon Experiencing Global Warming?
Students use data to determine if the climate in Portland has changed over the years. In this weather lesson students complete line graphs and study long wave radiation.
Curated OER
Differences Between Ground and Air Temperatures
Young scholars examine the differences between air temperature and ground temperature. In this investigative lesson students find NASA data on the Internet and use it to create a graph.
University of Colorado
The Moons of Jupiter
Middle schoolers analyze given data on density and diameter of objects in space by graphing the data and then discussing their findings. This ninth installment of a 22-part series emphasizes the Galilean moons as compared to other...
Curated OER
The Reason for the Seasons
Students compare graphs of their data that was generated on a NASA website. In this seasons lesson students complete a lab activity.
Curated OER
Matchstick Math: Using Manipulatives to Model Linear, Quadratic, and Exponential Functions
Playing with matches (unlit, of course) becomes an engaging learning experience in this fun instructional unit. Teach pupils how to apply properties of exponential functions to solve problems. They differentiate between quadratic and...
Chicago Botanic Garden
Climate Change Around the World
It is unknown if cloud cover increases in response to carbon dioxide levels changing, helping climate change slow down, or if cloud cover decreases, allowing Earth to warm faster. Part four in the series of five lessons has classes...
Curated OER
M&M's and the Scientific Method
Sixth graders explore the scientific method by conducting an in class experiment. In this scientific averages lesson, 6th graders discuss the concept of the scientific method, and define the different mathematical averages, mean, median...
Curated OER
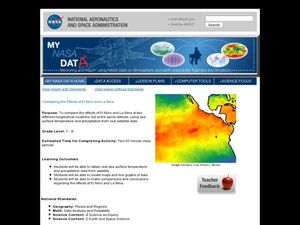
Comparing the Effects of El Nino and La Nina
Students examine the differences between an El Nino and La Nina year. In this investigative lesson students create maps and graphs of the data they obtained.
Curated OER
Think GREEN - Utilizing Renewable Solar Energy
Learners use data to find the best renewable energy potential. In this solar energy lesson students import data into Excel and explain how solar energy is beneficial.
Curated OER
Carbon Monoxide and Population Density
Tenth graders investigate the carbon monoxide level at a fixed latitude. They determine if there is a relationship to population density. They download data sets and generate a graph. They determine a link between human activity and...
Curated OER
Does Humidity Affect Cloud Formation?
Students use S'COOL data to identify factors that affect cloud formation. They find a data set using the S'COOL database , and use Excel to manipulate the data. Student isolate relevant data, create meaningful graphs from a spreadsheet,...
Polar Trec
Beacon Valley Weather
In Beacon Valley, katabatic winds regularly knock fit adults to the ground. The lesson compares the actual temperatures to the wind chill after factoring in katabatic winds in Beacon Valley. Scholars learn to calculate wind chill and...
Curated OER
Profitable Soda Stand
Am I making any money? Help learners determine if their fictitious soda stand is turning a profit. They graph linear equations using the slope and y-intercept and identify the best price to use to sell soda. They identify the domain and...
Curated OER
Water Conservation
Open learners' eyes to the challenge of finding safe drinking water – something we often take for granted in our country. The PowerPoint presentation includes images, graphs, diagrams, and even a video to stimulate discussion on how we...
Alabama Learning Exchange
How Old is Your Money?
Elementary learners explore coin mint dates. First, they listen to the book Alexander Who Used to be Rich Last Sunday by Judith Viorst. They then sort a collection of coins according to their mint date and put them in order from oldest...
Curated OER
Mean, Median, Mode, etc.
Explore the concept of mean, median, and mode with pupils. They estimate the length of a string or the number of M&M's in a jar. Then find the mean, median, and mode of the class' estimates.
Space Awareness
The Thermal Layers of Oceans
How much does the sun heat up a lake or ocean? Scholars use a cup and a strong lamp to investigate the heat transfer and thermal layers in the ocean to come up with the answer. They collect data and graph it in order to better understand...
Curated OER
Linkages Between Surface Temperature and Tropospheric Ozone
Young scholars use data microsets of mean near-surface air temperature and tropospheric ozone residual averages to infer patterns. Students analyze changes in tropospheric ozone and then hypothesize about the consequences of these changes.
Curated OER
The Barbie Bungee Drop
What do math, bungee jumping, and Barbie® have in common? Young adventure seekers use rubber bands as bungee cords to predict a thrilling, but safe, jump for their doll. First, test jumps are conducted with a few rubber bands. Then more...


