Curated OER
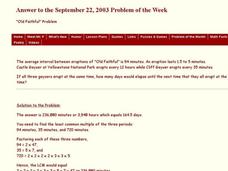
Old FaithFul Problem
In this algebra worksheet, 9th graders calculate the time that lapses between eruption of old Faithful. They try to time when all three geysers will erupt if one erupts every 94 minutes and lasts from 1.5 - 5 minutes. There is an answer...
Curated OER
Matching the Number
In this algebra worksheet, 11th graders answer a variety of questions dealing with math and science. They match the letters in the questions to the number of the questions. There are 14 questions with an answer key.
Curated OER
Mean Meadian and Mode
Students apply central tendencies to given data. In this statistics lesson, students calculate the mean, median, and mode as it relates to their data. They collect data and graph it while identifying the way the numbers are ordered.
Curated OER
Velocity
For this pre-calculus worksheet, students calculate the velocity of a linear graph by observing the slope of a line. There are 10 velocity questions.
Curated OER
Proportions in Flight
Sixth graders explore physics by utilizing their math skills. In this flight properties lesson plan, 6th graders examine the flying capabilities of planes and birds. Students utilize math to find how many wing-beats are needed to keep a...
Curated OER
Proportions and Percents
In this Algebra I worksheet, 9th graders use proportions to solve problems involving percents. The one page worksheet contains a combination of ten multiple choice and free response problems. Answers are provided.
Curated OER
Measures of Central Tendency
In this Algebra I worksheet, 9th graders determine the measures of central tendency for a given data set. The one page worksheet contains four problems. Answers are provided.
Curated OER
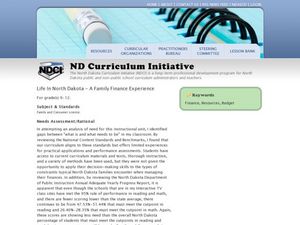
A Family Finance Experience
Learners create a budget and make predictions about money. In this algebra lesson,students balance spending and income by monitoring their finance.
Curated OER
Weather, Data, Graphs and Maps
Learners collect data on the weather, graph and analyze it. For this algebra lesson, students interpret maps and are able to better plan their days based on the weather reading. They make predictions based on the type of clouds they see.
Curated OER
Algebra 1 Unit 8 Review
In this math worksheet, students practice the techniques associated with algebra 1. This 5-page worksheet has many different types of problems for the students to solve.
Curated OER
Designing a Speedometer
In this algebra worksheet, students analyze the designs of a speedometer. They collect data on the distance and time as the speedometer works. They draw conclusion and make predictions from the collected data. There are 4 word problems.
Curated OER
Circles in the Landscape: Irrigating Oklahoma Crops
How do you grow crops in a area with insufficient rainfall? Why you irrigate, of course. Class members investigate irrigation systems by designing a system of their own. After examining irrigation related concepts, vocabulary terms, and...
Curated OER
Single Step Operations
In this single step operations worksheet, students solve word problems. In his short answer worksheet, students write answers to eight problems.
Curated OER
Algebra: Olympic Races
Students use Olympic athlete statistics to make algebraic calculations. In this algebraic equation lesson, students use algebra to calculate athlete speed and calories burned.
Curated OER
Don't Burst My Bubble
Students practice using measuring techniques by examining bubbles. In this geometry activity, students utilize mathematic formulas to discover the circumference and diameter of soap bubbles they blow. Students practice creating larger...
Curated OER
Woodland Math Facts
In this Woodland math facts worksheet, students study and examine woodland weights of trees and shrubs, explore invertebrates and draw a bar chart to chart their findings.
Curated OER
Significant Figures and Scientific Notation
In this significant figure worksheet, high schoolers identify significant figures. They convert numbers from standard notation to scientific notation. This one-page worksheet contains 14 problems. Answers are included at the bottom of...
Curated OER
Equations and Inequalities
In this equations and inequalities instructional activity, 9th graders solve and complete 10 different problems that include selecting the appropriate letter that complete each problem. First, they determine the solutions of various...
Curated OER
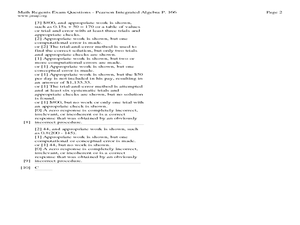
Math Regents Exam Questions
In this Algebra I/Algebra II activity, learners solve distance-rate-time word problems. The one page activity contains a combination of eight multiple choice and free response problems. Answers are provided.
Curated OER
Practice Chapter Test
In this algebra worksheet, students identify the property being used in each problem. They plot numbers on a number line. There are 30 questions.
Curated OER
Graphing Linear Equations
Students graph linear equations. In this algebra lesson, students investigate the price of tolls in different states and create a graph. They analyze their graph and draw conclusions.
Curated OER
Linking Algebra to Temperature
Students convert between two units as they calculate the temperature. In this algebra lesson, students collect data on seasonal climate and create a graph. They make conjectures based on their data collection.
Curated OER
Box Plots
Students review the concept of median, explore how to calculate quartiles for any size data set and experience how to build a box plot.
Curated OER
Using Symmetry to Find the Vertex of a Parabola
Learners engage in a lesson that is about finding the vertex of a parabola while using symmetry. They use the symmetry to find out where the two lines meet. The line is displayed with the help of a graphing calculator. The lesson...
Other popular searches
- Average Speed
- Average Velocity
- Calculating Averages
- Algebra 1 Weighted Averages
- Batting Averages
- Average Time Difference
- Teaching Averages
- Average Atomic Mass
- Average Rate of Change
- Average Speed and Velocity
- Weighted Averages
- Finding Averages


