Curated OER
Quiz: Mean, Median, Mode, and Range
Use this measure of central tendency worksheet to have learners find mean, median, mode and range of ten sets of nine numbers. Numbers are presented in a series of lists.
Houghton Mifflin Harcourt
Unit 4 Math Vocabulary Cards (Grade 4)
Looking for a set of math vocabulary cards for fourth graders? A 14-page packet of vocabulary words includes topics related to multiplication, division, and factor types. Each sheet has two cards on it: the top half has the word in bold...
Curated OER
Stem-and-Leaf Plots
In this stem-and-leaf plots worksheet, 8th graders solve and complete 3 different problems that include creating stem-and-leaf plots to solve problems. First, they determine the median, minimum, range and mode of the given set of numbers...
Curated OER
How To Make Faint Things Stand Out In a Bright World!
In this averaging and pixel activity, students solve 5 problems including finding the average value of 9 images given pixels, distinguishing between background 'noise' and the source and detecting faint sources in bright backgrounds.
Curated OER
Mean
In this on-line math worksheet, students complete 5 multiple choice questions where they find the average, or mean, of sets of numbers. Students can check their answers at the end of the worksheet.
Curated OER
Mean, Median and Range
In this measures of central tendency worksheet, students solve 6 problems. Students analyze the set of given numbers and calculate the median, mean and range for each.
Curated OER
Mode, Median, Mean
In this mean, median, and mode activity, students find the mean, median, and mode for each set of numbers given. Students complete 5 problems total.
Curated OER
Explorit's Do-It-In-Your-Head Numbers Quiz
In this mental math activity, students complete a 6 question multiple choice online interactive activity without using pencil, paper or calculator. Included are word problems, multiple operations, averaging, and basic arithmetic.
Curated OER
I Can Average Grades Like My Teacher!!!
Fifth graders investigate the mean of a data set. In this fifth grade mathematics instructional activity, 5th graders determine the mean of sets of numbers using a calculator. Students use a blank role book page to create grades for...
Curated OER
Speeding By The Numbers
Students determine speed by running or walking a given distance and dividing the distance by the time it took them to do so. They record their average speed and compare it with the speeds of other moving objects.
Curated OER
Calculating Baseball Statistics
Students calculate baseball statistics. In this data analysis lesson plan, students use baseball statistics to calculate the batting average and slugging percentage. Students visit www.funbrain.com to play a math baseball game.
Curated OER
Finding Averages
Students have problems in the lesson where they need to find the average of a set of numbers. As a class, they work a few problems and then independently complete a worksheet practicing their new skill.
Curated OER
Mathemafish Population
It's shark week! In this problem, young mathematically minded marine biologists need to study the fish population by analyzing data over time. The emphasis is on understanding the average rate of change of the population and drawing...
Curated OER
A Trillion Here...A Trillion There
In this working with large numbers worksheet, students are given the finance statistics for the US and the world for the 2006-2007 year. Students solve 11 problems including finding averages and percentages for the given statistics and...
Raytheon
Working With Mode, Median, and Mean
For this data analysis worksheet, students solve five questions by finding the mode and median of each set of numbers. On the second page, students find the mean of six sets of numbers. On the third page, students find the mode, median,...
Curated OER
Number Sense and Operations
In this number sense and operations worksheet, 9th graders solve and complete 15 various types of multiple choice problems. First, they evaluate a few different functions shown. Then, students write numbers given in scientific notation....
Curated OER
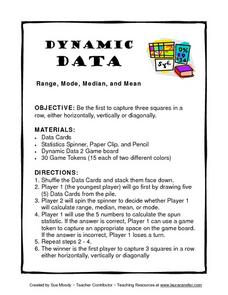
Dynamic Data Range, Mode, Median, and Mean
For this lesson, Dynamic Data Range, Mode, Median, and Mean, young scholars play a game while figuring range, mode, median, and mean. Students spin for their task, figure the mode, mean, median or range of a row of numbers and gain a...
Curated OER
Unit 8 - Statistical Diagrams
In this statistical diagrams learning exercise, students solve 30 short answer problems. Students find the mean of a set of numbers and read/interpret a graph to answer questions. Students determine the x-values that satisfy a y-value...
Curated OER
Functions
For this functions worksheet, students solve and complete 5 different sets of problems that include determining functions on intervals. First, they define a definite integral and the Fundamental Theorem of Calculus. Then, students draw a...
Willow Tree
Midpoint and Distance Formulas
The shortest distance between two points is a straight line. Learners use the Pythagorean Theorem to develop a formula to find that distance. They then find the midpoint using an average formula.
Inside Mathematics
Population
Population density, it is not all that it is plotted to be. Pupils analyze a scatter plot of population versus area for some of the states in the US. The class members respond to eight questions about the graph, specific points and...
Balanced Assessment
Lotto
You can't win if you don't play! Find out how to increase your chances of winning the lottery. Scholars analyze a state lottery system for the probability of winning. They also consider different combinations of numbers and how they...
DK Publishing
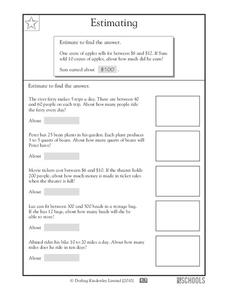
Estimating
Through estimating, scholars are able to make these word problems simpler as they multiply to find approximate answers. Using an example as guidance, they solve five scenarios, each of which has space for learners to show their work. The...
Illustrative Mathematics
But Mango Is My Favorite...
Opening up a package of fruit snacks is like a box of chocolates, you never know what you're going to get. When all the mango flavored ones are missing, learners calculate the probability that one bag versus the whole box is missing the...


