Curated OER
Final Exam Multiple Choice
Twelfth graders review the properties of derivatives without a calculator to get ready for their test. In this calculus lesson, 12th graders review average rate change, parametric equations, a line tangent to a curve, quotient rule, and...
Curated OER
Final Exam Multiple Choice part B
Twelfth graders review the properties of derivatives without a calculator to get get ready for their test. In this calculus instructional activity, 12th graders review average rate change, parametric equations, a line tangent to a curve,...
Curated OER
Lab 2: Drag Racing
In this lesson, students, Analyze the relationship between velocity and acceleration * Calculate an object's average acceleration * Collect data and interpret it* Create and analyze a graph showing acceleration.Students also work in...
Curated OER
Logarithmic Functions
Learners explore the characteristics of logarithmic functions and their relationship to exponential functions. Using the subscriber website Explorelearning.com, pupils observe changes in the input variable and its effect on the graph of...
Curated OER
A.P. Calculus Exam Prep
In this A.P. Calculus exam practice test, students answer 28 multiple choice questions. Questions cover a wide variety of topics. Students tell the position of a particle moving along a horizontal line. They identify the solution to a...
PBS
What We Do Adds Up
With so many tons of trash going into landfills each year, your environmentalists can calculate how much the average person is tossing away. This activity has a series of questions not only requiring math, but a conscious thought of how...
Curated OER
The Euro: Classroom Exercises – Exchange Students Going to Europe
Students explore ever-changing exchange rates. In this euro/dollar exchange rate lesson, students plan a trip to Europe and calculate their costs in euros and dollars.
Curated OER
My Peanut Butter is Better Than Yours!
Students explore the concept of statistical data. For this statistical data lesson, students read an article about the dangers of peanut butter to those who are allergic. Students perform a taste test of two different brands of peanut...
Curated OER
Mathematical Modeling
Study various types of mathematical models in this math lesson plan. Learners calculate the slope to determine the risk in a situation described. They respond to a number of questions and analyze their statistical data. Then, they...
Curated OER
Carbon Dioxide Increases
In this atmospheric carbon dioxide worksheet, students use a graph of the Keeling Curve showing the increase in atmospheric carbon dioxide since 1958 to solve 6 problems. They determine the rate of increase, the find the percentage of...
Bowland
Cats and Kittens
Can a cat have 2,000 descendants in 18 months? To determine if this claim is realistic, individuals must take different pieces of information into account when justifying their responses.
Curated OER
Introduction to Mathematical Modeling
In this mathematical modeling learning exercise, students answer two essay questions. They describe Newton's Law of Cooling by describing and constructing a model and answering seven essay questions about the process.
Curated OER
The International Space Station
In this International Space Station instructional activity, students are given the altitude changes in the space station on a graph from 2000-2004. Students answer 5 questions about the trends in the graph, the changes in altitude, the...
Curated OER
Wind Power
Fourth graders develop an understanding of how engineers use wind to generate electricity. They will build a model anemometer to better understand and measure wind speed. They discover that engineers design wind turbines that generate...
Curated OER
Population Growth
Students calculate human emission rate by year 2050. For this social studies lesson, students watch a video online and analyze population trends. They explain how e total emissions affect global climate.
Curated OER
Groundwater Basics
Students explore the volume of groundwater using math problems. They compute mathematical problems to figure the volume of groundwater and calculate the average porosity in an aquifer. Students estimate the amount of water needed to...
Curated OER
Pike's Peak Problem
In this algebra worksheet, students answer a word problem about a distance-rate multiplied by times problem. They discuss slope and altitude. There is an answer key with this problem.
Curated OER
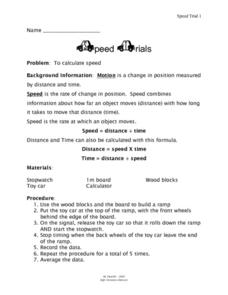
Speed Trails
In this Algebra I/Algebra II learning exercise, students conduct an experiment with toy cars in order to calculate and compare average, instantaneous, and constant speed. The two page learning exercise contains three questions. Answers...
West Contra Costa Unified School District
Comparing Linear and Quadratic Functions
If a linear function and a quadratic function enter a boxing match, which one would win? Learners first review how to find key features of linear and quadratic functions. Next, they compare key features of pairs of functions.
Mt. San Antonio Collage
Quiz 1: Functions, Domain and Range
Take the work out of worksheets and use these problems and worked-out answer key as a resource. The problems reinforce skills in domain and range, identifying graphs, and even and odd functions.
EngageNY
Modeling with Exponential Functions
These aren't models made of clay. Young mathematicians model given population data using exponential functions. They consider different models and choose the best one.
EngageNY
Interpreting Quadratic Functions from Graphs and Tables
Seeing functions in nature is a beautiful part of mathematics by analyzing the motion of a dolphin over time. Then take a look at the value of a stock and maximize the profit of a new toy. Explore the application of quadratics by...
Illustrative Mathematics
Bike Race
A graph not only tells us who won the bike race, but also what happened during the race. Use this resource to help learners understand graphs. The commentary suggests waiting until the end of the year to introduce this topic, but why...
Curated OER
Partial Derivatives for a Function of Two Variables
For this partial derivatives worksheet, students complete one word problem by finding the (x,y) coordinates of a point when it moves parallel to one axis. When given a function, they find six partial derivatives. Students solve four...


