Curated OER
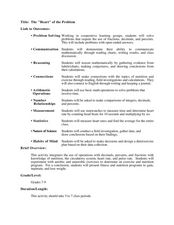
The "Heart" of the Problem
Students create an exercise and nutrition program. In this interdisciplinary lesson, students use calculations of exercises plus their corresponding effects on the body and nutritional values of food to derive a health plan. Students...
Curated OER
The Stock Market: High School Economics
High school economists learn about the stock market in a project where they "buy" and track stocks. The author of this resource reports it is the high point of her 12th grade economics course, but no resources are attached. After viewing...
Curated OER
Bar Graphs
Third graders examine the main parts of a bar graph and how to round up to the nearest tenth. They make an example of a bar graph and answer questions based on the graph using a list of state capitals and their average temperatures....
Curated OER
Mean, Median and Mode (I)
In this online math activity, find the mean, median, and mode in a variety of sets of data. This excellent resource allows the students to check their answers, and to get "hints" should they run into difficulties. A terrific teaching tool!
Curated OER
Confidence Intervals: Population Mean; Population standard Deviation Known
In this confidence interval worksheet, learners examine a given confidence level and sample data to determine the margin of error, identify a confidence interval, list the mean and give the standard deviation. Students complete seven...
Curated OER
Mean, Median and Mode
Young statisians work with sets of data. They find mean, median and mode, and discuss the effects of outliers on the data set.
Curated OER
Making Sense of the Census
Learners problem solve the mean and median of agricultural data by completing a worksheet. They discuss the results of the statistical data.
Curated OER
Density of a Paper Clip Lab Review
Even though this assignment is brought to you by Physics Lab Online, it is best used as a math practice. Middle schoolers calculate the range, mean, mode, and median for a list of eight different paper clip densities. They analyze...
Curated OER
Mean, Median, Mode, and Range - Homework 14.3
For this data and statistics worksheet, students find the mean, median, mode, and range of 4 different sets of data. Next, students solve 1 word problem where they find the mean.
Curated OER
Cumulative Frequency - Mental Tests
In this measures of central tendency activity, quick-thinking pupils use mental math to find the mean, median, and range of samples. They use mental math to calculate subtraction problems. They complete 20 problems in which the answers...
EngageNY
The Mean Absolute Deviation (MAD)
Is there a way to measure variability? The ninth resource in a series of 22 introduces mean absolute deviation, a measure of variability. Pupils learn how to determine the measure based upon its name, then they use the mean absolute...
North Syracuse Central School District
Nutrition Label Worksheet
Nutritional labels are everywhere, yet so few of us take the time to use them! Here is a worksheet that learners can use to practice calculating such features as calories, carbohydrates, and serving size based on real examples of...
STEM for Teachers
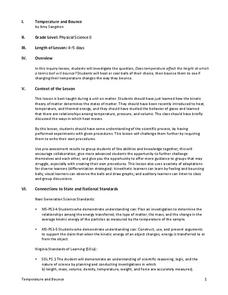
Temperature and Bounce
Take part in a fun experiment and hold an impromptu bouncing contest with your class. Young scientists heat and cool balls before bouncing them to determine whether temperature changes affect how they bounce. The set of STEM lesson plans...
American Chemical Society
Energy and Entropy of a Stretched Rubber Band
Stephen Perry invented and patented the modern rubber band in 1845. Young scientists put his discovery to work as they use rubber bands to observe entropy and enthalpy. They determine the change in free energy to figure out if it...
ProCon
Vegetarianism
What do Mike Tyson, Ellen DeGeneres, and Paul McCartney have in common? They're all famous vegetarians. Using the resource, scholars learn about the pros and cons of eating a vegetarian diet. They read a fascinating history of...
College Board
2007 AP® Calculus AB Free-Response Questions Form B
What do the questions look like? Six free-response questions provide pupils with knowledge of how calculus topics appear on the AP® Calculus exam. The questions involve calculator and non-calculator problems by providing mathematical and...
Curated OER
Sky High Fuel
For this fuel price worksheet, students examine a chart that shows fuel prices between 2001 and 2005. They compute the answers to 3 word problems in which they work with finding average. They complete an extension activity in which they...
Curated OER
The Bigger they Are . . .
Young scholars do a variety of data analyses of real-life basketball statistics from the NBA. They chart and graph rebounding, scoring, shot blocking and steals data which are gathered from the newspaper sports section.
Curated OER
Working with Rates of Change
In this calculus worksheet, students problem solve 8 word problems involving rates of change in association with high school students. Students work out each problem and give a short explanation of each answer.
Curated OER
Univariate Data Analysis
Students use given data to compare baseball players. They create box and whisker plots to compare the players and determine which they feel is the best player. Students use calculators to make box and whisker plots. They write paragraphs...
Curated OER
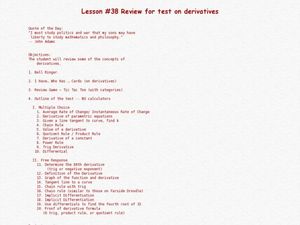
Review for Test on Derivatives.
Students review derivatives and equations for their test. In this calculus lesson, students review average rate, parametric equations, tangent line to a curve and value of a derivative to prepare and show mastery on a chapter test. They...
Curated OER
Not Just an Average Class
Fourth graders work together to find the median, mode, and mean of their first and last names using a numerical code in this fun, interactive lesson. After a lecture/demo, 4th graders utilize a worksheet imbedded in this plan to gain...
Curated OER
Why is the Average Temperature Greater on Venus than on Mercury?
Middle schoolers examine the reasons why the temperature is higher on Venus than on Mercury. In groups, they analzye both planet's atmospheres and determine the rate of global warming on each. They use the internet to research the...
Curated OER
Dollar Value and Fast-Food Nutrition
Learners examine how they can make changes to form healthy eating habits. In this investigative lesson students examine food guidelines and the food pyramid.


