Virginia Department of Education
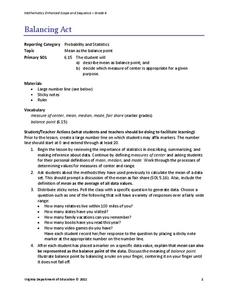
Balancing Act
How many different interpretations of the mean are there? Scholars place numbers on a number line and determine the mean. They interpret the mean as the average value and as the balance point.
Curated OER
Button Bonanza
Collections of data represented in stem and leaf plots are organized by young statisticians as they embark some math engaging activities.
Curated OER
Math - Blank Jeopardy
Double Jeopardy! Review polynomials, statistics, triangles, graphing, mode, median, mean, measurement, slope, distance, and ratio. Note: Have everyone use a white board to do the problems to get a quick check on understanding.
Curated OER
Math: Real Time and Live
Get an interdisciplinary edge. Scholars study air contamination and slope. They record the time it takes for air fresheners to reach them at variable distances. They document their times, classify them by distance, and draw a scatter...
Curated OER
The Average Kid
Students determine the traits they have in common with other students in the class and create visual profiles of the "average" boy and the "average" girl.
Curated OER
8.SP.1Texting and Grades I
Here is a fitting question for middle schoolers to consider: Is there a relationship between grade point average and frequency of sending texts? Starting statisticians examine a scatter plot and discuss any patterns seen.
Mathematics Assessment Project
Mean, Median, Mode, and Range
What a find! Here is a lesson, designed to meet sixth grade math Common Core standards, that focuses on the calculation of different measures of center for the scores from a penalty shoot-out competition. An independent...
Curated OER
What's Your Average? What Do You Mean? I'm More Than Just Average
Upper grade and middle schoolers collect data, analyze and interpret the data. This three-part lesson should provide learners with a firm understanding about the differences between mean, median, and mode and how to perform the...
Curated OER
Investigation - How Tall is the Average Sixth Grader?
Pupils will measure each other and record the data in inches. They will use a stem and leaf plot to display data and figure out the average height of the students in a class. The other statistical data will be collected like the mode and...
Curated OER
Sports Teams & Math
Students collect sports data, keep track of wiins, losses and scores and average the teams' scores.
Curated OER
Fun with Math using Magnetic Force
Sixth graders explore and discuss the effectiveness of magnets in different situations. For this math lesson, 6th graders discuss rate and graphs after exploring with magnets using different restrictions on the magnets. They analyze...
Curated OER
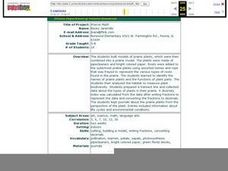
Prairie Math
Students work together to build models of prairie plants. Using the model, they estimate the height and then measure them using metric and standard units. They write a fraction to represent their part of the whole set and compare and...
Curated OER
Sports and Hobby Math
Explore math concepts as they relate to real world situations. Young analysts consider a personal hobby or favorite sport and list three ways math is involved in the hobby. They create several related math story problems and write a...
Curated OER
What Does Average Look Like?
Fifth graders explore the concepts of range, median, mode, and mean through the use of graphs drawn from models. They use manipulatives to represent data they have collected within their groups, and compare the differences between mode,...
Curated OER
Math Regents Exam Questions: Lesson 1-6 - Mean, Median, Mode and Range
In this mean and median worksheet, students examine given data and determine the measures of central tendency for the data. Students compute the mode, mean, median, and range of data. They create stem-and-leaf plots. This ten-page...
Scholastic
Study Jams! Double-Digit Division
RJ had an awesome basketball season this year! Use division by double-digit numbers to calculate his scoring average in this instructional presentation. Starting with an explanation of the terms dividend, divisor, and quotient, the long...
Curated OER
Sunshine Math- 4 Jupiter, IV
In this math applications worksheet, students solve 8 varied problems that include: temperature, possible outcomes, calendar, volume, averages, basic operations and reasoning.
Bismarck Public Schools
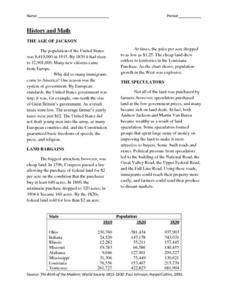
History & Math of the 1830s
Using this interdisciplinary worksheet, your young historians will have the opportunity to practice their math skills while learning about the drastic population increase in the United States during the presidency of Andrew Jackson....
Curated OER
Problem Solving with Batting Averages
Fifth graders use data from an Excel document to analyze and predict trends in batting averages.
Curated OER
Finding Averages
In this averages and mean worksheet, 4th graders find the average and/or mean of 5 groups of numbers and place their answers on the lines provided.
Curated OER
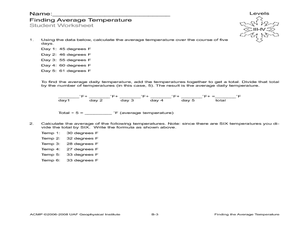
Finding the Average Temperature
Students calculate averages. In this average temperature instructional activity, students collect data and use their problem solving skills to calculate average temperatures.
Curated OER
Averages
In this averages worksheet, students read an explanation and examples of how to find the average of a set of numbers. They then use what they learned to find the averages of 4 sets of numbers. The answers are on the last page of the packet.
Curated OER
Average Values
In this averaging worksheet, students solve four word problems. Each problem presents students with a situation involving three or more subjects and asks students to compute the average height, time, age, or number of students.
Curated OER
Leveled Problem Solving: Experimental Probability
In this using probability to solve word problems worksheet, learners use statistics, averages, and even numbers, to problem solve. Students solve six problems.


