Curated OER
Understanding Presidential History
Students research to find the qualifications necessary to be President of the U.S. In this presidential qualification lesson, students research their family roots to see if they could qualify to be President. Students create a graph to...
Curated OER
Download and Analyze
Students download information from a NASA website into a database. They transfer it to a spreadsheet by completing the information and analyze the information. They determine temperature averages, mode, and graph the results. They write...
Curated OER
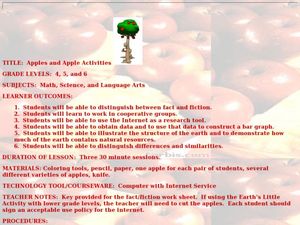
Apples and Apple Activities
Students investigate apples. In this reading comprehension activity, students read a book about apples then compare and contrast, make graphs, distinguish between fact and fiction and work in groups. Students work in...
Curated OER
Black History Project
Third graders explore and analyze about famous African-Americans by listening to four picture book biographies. They generate a list of 15 famous African-Americans and then create a survey to rank them according to importance of...
Curated OER
Clouds
Students explore basic cloud types and the weather associated with each one. In this earth science lesson, students participate in numerous activities including going outside to observe the clouds they see, making a cloud in a...
Curated OER
When Dinosaurs Ruled the World
Students graph the varying sizes of dinosaurs. In this math and dinosaur lesson, students view dinosaur models and compare the different shapes and sizes of the dinosaurs. Students complete a dinosaur math activity, read The...
Curated OER
December Celebrations
Students study customs of various winter holidays. In this holiday lesson, students read the book The Reasons for the Seasons and complete a winter glyph. Students use graphing software to create a chart of the holidays that are celebrated.
Curated OER
The World is a Village
Students observe Americans through the eyes of the world. In this human population lesson plan, students utilize the Internet to view the World Pop Clock and follow the world's population by the minute. Students predict what...
Curated OER
Probabilities for Number Cubes
Students explore the concept of probability. In this probability lesson, students roll a six-sided number cube and record the frequency of each outcome. Students graph their data using a frequency chart and keep tally marks...
Curated OER
Weather Data Analysis
In this weather instructional activity, students read a data table comparing the temperature and weather conditions at three different locations. Students use this data to complete 8 fill in the blank, 1 short answer question, and one...
Curated OER
Yummy Apples!
Students discuss apples and how they are grown. They listen as the teacher reads "Apples," by Gail Gibbons. Students discuss the story. They view several different types of apples and compare their characteristics. Students taste several...
Curated OER
Neighborhoods
Students examine homes around the world. In this multicultural lesson, students read the book A World of Homes and Homes Around the World. Students compare and contrast the homes in the books to their own homes. Students construct a...
Curated OER
After the Garbage Can: Where Does Our Trash Go?
Students explore how waste disposal has changed over time and what the current issues are. In this disposal lesson students collect data and create graphs.
Curated OER
How Long? How Wide?
Second graders distinguish between and use nonstandard and standard units of measurement, use appropriate tools and techniques to measure length and width, and record and interpret data using graphs.
Curated OER
Spicy Hot Colors
First graders discover the importance of primary colors by reading a book in class. In this art lesson, 1st graders read the book Spicy Hot Colors, and discuss the three primary colors and the numerous combinations they can make....
Curated OER
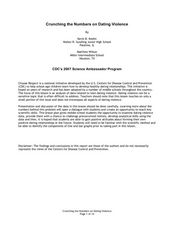
Crunching the Numbers on Dating Violence
Students read about potential violent relationships and beliefs about dating. In this relationship lesson students use graphs to examine data about healthy realtionshipsand draw conclusions on their results.
Curated OER
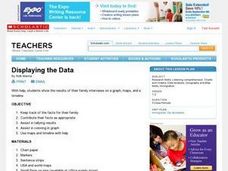
Displaying the Data
Students gather facts about their parent's families through the completion of parent interview forms. Using tally marks, the data gathered is counted, transferred to graphs and used to create family timelines.
Curated OER
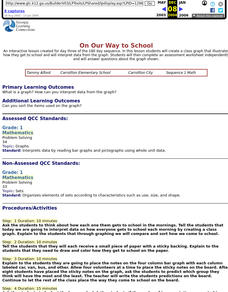
On Our Way to School
First graders create a class graph that illustrates how they get to school and interpret data from the graph. They complete an assessment worksheet independently and answer questions about the graph shown.
Curated OER
Active Learning
Students practice using measurements and bar graphs to solve a running problem in this active Math lesson for various age levels. The lesson meets state standards in Mathematics and requires the use of "math journals" for final...
G. Turrell
Science Activity 1: Light & Sound
Are you looking for lab sheets to go with your class experiment on plant response to light? You are no longer in the dark! This is a lesson that was written for a unit on light, but could easily be used to demonstrate plant behaviors in...
Special needs in Music
Music Work Sheet (Special Ed)
Music is beneficial for all learners. Help your learners with special needs learn about different styles of music, as well as the ways that music is represented on paper, with 30 different worksheets.
Curated OER
All in the Family
Students use data to make a tally chart and a line plot. They find the maximum, minimum, range, median, and mode of the data. Following the video portion of the lesson, students will visit a Web site to test their data collection skills...
Curated OER
Interpreting Data and Statistics
Students define terms and analyze data. In this statistics activity, students plot their data using bar and line graphs. They analyze their data after they graph it and apply the results to the Great Depression.
Curated OER
Linear Inequalities
Students explore how to graph a linear inequality. They determine if a point is in the solution set. Students solve linear inquality application problems. They graph linear equations, and solve linear equations for a given variable.


