Curated OER
Five Colors Bar Graph-Make a Bar Graph
Two worksheets are provided here that contain the same information but ask different questions. The first worksheet has the learner draw the graph themselves before answering the questions that follow, and the second worksheet has the...
Curated OER
Data Collection
Students write a journal exercise that relates to pets. They collect information from each other in order to practice making and interpreting bar graphs. They Continue building different kinds of graphs with the group.
Curated OER
What's in a Graph?
How many yellow Skittles® come in a fun-size package? Use candy color data to construct a bar graph and a pie chart. Pupils analyze bar graphs of real-life data on the Texas and Massachusetts populations. As an assessment at the end...
Curated OER
Survey of Height
In this data collection worksheet, students survey the heights of their fellow classmates, organize their data in a data table, and create a bar graph from their data. Once bar graph is completed, students complete 2 short answer...
Curated OER
How Soluble Is It?
Is sugar more soluble than salt? Experiment with water and solubility with an elementary science activity. After interpreting data from a bar chart, fifth graders use different types of sugar to determine if the size of sugar particles...
Curated OER
Graphing the Forecast-Line Graph or Bar Graph?
Students explore bar and line graphs. In this data collection, graphing, and weather lesson, students compare bar and line graphs and discuss which type of graph would be most appropriate for displaying a ten day weather forecast....
Curated OER
Busted Bubbles
Using the scientific method, and bubble gum, learners conduct a motivating experiment. After conducting a series of tests involving bubble gum, they graph and analyze their results. This is the type of activity everyone loves.
Curated OER
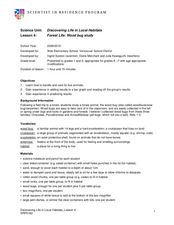
Forest Life- Wood Bug Study
Examine wood bugs and their habitat. Learners gather wood bugs and examine their bodies. Then discuss their body parts and how they help them survive. They also predict where they think wood bugs live to then graph the class results.
Curated OER
Learning to Make Line Graphs
Students analyze data and create a line graph. In this graphing lesson, students explore data from a previous experiment and plot the information on a line graph. Students analyze their findings.
Curated OER
Applied Science - Science and Math Lab
Students make a prediction. For this applied science lesson, students guess the number of items in a jar. Students create a bar graph to show the predictions and the actual amounts.
Curated OER
ELECTRICITY 1
Fifth graders examine the importance of electricity to their everyday lives, practice plotting and interpreting data on a bar graph, and reflect in their journals about how their lives would change without electricity.
Curated OER
Interpreting Data from Birdfeeders
What kinds of birds live in your area? Read a book about birds to your learners and explore their feeding patterns. Charts and graphs are provided in this three page packet, but consider assigning the basic questions if using with young...
Berkshire Museum
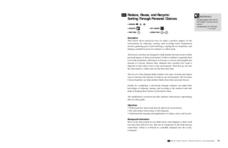
Reduce, Reuse, and Recycle: Sorting Through Personal Choices
Raise children's awareness about the importance of conservation with this hands-on science lesson. Start by breaking the class into groups and having them collect trash from around the school or local park. Students then use the provided...
Curated OER
Graph a Panther's Diet
Students examine the diet of panthers. In this interpreting data lesson, students collect data on the panther's diet and chart the data in bar and pie graphs.
Curated OER
Deciding Which Type of Graph is Appropriate
In this graphing instructional activity, students read about line, bar, and pie graphs and then determine which graph is the best way to express data results. This instructional activity has 3 short answer questions.
NOAA
Biological Oceanographic Investigations – Keep Away
As of 2015, there are 53,481 oil wells in the Gulf of Mexico. Scholars determine how species diversity is impacted based on the ecosystem's distance from a drilling platform. It focuses on finding the mean of data sets...
Curated OER
Aerosol Lesson: Science - Graphing SAGE II Data
Students examine and plot atmospheric data on bar graphs.
Curated OER
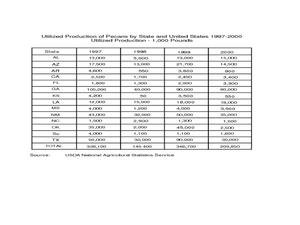
Pecan Power
Students study the origins of pecans and complete a bar graph from the data they have discovered. In this pecan lesson plan, students draw pecans, discuss a pecan time line, and draw a bar graph comparing Arizona pecans to other...
Curated OER
Bluebird Eggs in Nestbox chart
In this bluebird eggs worksheet, students fill out the chart which resembles a bar graph on how many eggs each bluebird has and answer short answer questions. Students answer 5 questions.
Curated OER
Speed
Fifth and sixth graders practice working in pairs to determine whether they can walk with constant speed. They test themselves, collect their data, draw graphs with their data collected, manipulate the data, and then draw conclusions...
Curated OER
Graphing - Length
In this graphing worksheet, students create a bar graph showing the approximate maximum length of 12 different types of fish.
Mixing In Math
Mixing in Math: Growing Plants
Whether you have your class plant seeds or begin when sprouts are visible, math skills are used here to predict and track growth over time. Straw bar graphs show plant height on a given day while the graph as a whole shows changes over...
Curated OER
Creating a Bar Graph with a Graphing Program
Students use the S'COOL data base to create a bar graph.
Curated OER
Graphing Predator/Prey Data
Young scholars use data from the Camouflage Game (played with red and green yarn caterpillars) to create a composite bar graph to display the collected data. They interpret the data and form a conclusion based on the graphs. Teachers may...
Other popular searches
- Skittles Bar Graph
- Double Bar Graphs
- Bar Graphs Pictographs
- Histogram and Bar Graph
- Bar Graphs and Histograms
- Bar Graph Problem Solving
- Favorite Food Bar Graph
- Bar Graphs Histograms
- Interpreting Bar Graphs
- Bar Graphs for Birthdays
- Bar Graph Worksheet
- Bar Graphs and Charts


