Curated OER
Which Holiday Parades Have You Seen?: Graph
First graders ask their classmates which holiday parades they have seen and record the responses to complete the graph. A basic lesson, but great for teaching or strengthening graphic skills.
Curated OER
Charts, Maps, and Graphs Lesson on the Holocaust
Young scholars practice interpreting data. In this Holocaust lesson, students research selected Internet sources and examine charts, maps, and graphs regarding the Jewish populations in and out of Europe. Young scholars respond to...
Curated OER
Economics Study Guide
Use this resource as a basic review of economic principles. There are six questions relating to the factors of production, opportunity costs, wants and needs, tangibles and intangibles, and more.
Curated OER
Favorite Season Circle Graph
Students create a graph charting their favorite season. They discuss the difference in the four seasons and activities they participate in, in each of the seasons. They can also take a survey of their family members and add them to the...
Curated OER
Student News And Weather Channel
Fabulous! Your 5th graders should love this project. As an ongoing lesson throughout the year students use temperature probes to record outside temperature and then document their data using spreadsheets. They use their weather data and...
Curated OER
Twelve Days of Christmas--Prediction, Estimation, Addition, Table and Chart
Scholars explore graphing. They will listen to and sing "The Twelve Days of Christmas" and estimate how many gifts were mentioned in the song. Then complete a data chart representing each gift given in the song. They also construct...
Curated OER
Mapping the News
Students explore cartography. In this map skills and map making lesson, Students work in groups to create wall size world maps including legends, compass roses, latitude and longitude, and physical features. Students collect...
Curated OER
Where Do I Live?
Students study the characteristics of communities. Students identify similarities and differences in communities. Students identify that all people have basic needs, understanding that these needs are met through the community. Students...
Curated OER
Money Circulation: A Story of Trade and Commerce
Students are introduced to the meaning, symbolism, and value of the quarter. They determine the percentage of total monetary value held in quarters and graph the results. Students infer about the U.S. Mint's distrubution of coins. They...
Curated OER
A Thanksgiving Survey
Young scholars take a survey then use the information gained from the survey to help plan a typical Thanksgiving dinner for our last day of class. They create a graph which corresponds the the data gathered during interviews.
Curated OER
World Population Study
Students explore an exponential relationship and how it relates to human population growth and the current global population crisis. They graph both exponential and linear information.
Curated OER
Technobiz
Students examine candy preferences to create a plan in order to improve candy sales. In this technobiz lesson, students build spreadsheet and organizational skills by graphing and calculating data. Students are introduced to terminology...
Curated OER
Water: From Neglect to Respect
The goal of this collection of lessons is to make middle schoolers more aware of the ways in which they are dependent upon water to maintain their standard of living. Learners compare water use in Lesotho to water use in the United...
Curated OER
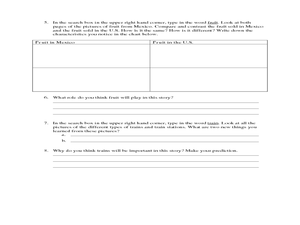
Esperanza Rising - Anticipation Guide
Learn about Mexican culture while simultaneously strengthening reading, writing and computer skills. In order to get the most out of Esperanza Rising, pupils should have prior knowledge of Mexican culture. Therefore, there are links to a...
Curated OER
Geo-Class Mapping My Neighborhood
Students create a map of the school and surrounding neighborhood. In this mapping lesson, students discover their school's location and learn about its past. Students use math skills and the steps in the design process to...
Curated OER
Exploring an Atlas
Learners explore global geography by participating in an atlas activity. In this countries of the world instructional activity, students collaborate in small groups and analyze an atlas while researching continents, countries and...
Curated OER
East Asia Country Project
Get your young historians thinking about East Asian culture and history during this partner research project, in which they analyze a variety of East Asian aspects to prepare for a presentation. After an initial "what do we already know"...
Council for Economic Education
Production Possibilities Curve
Demonstrate the important economic principles of the production possibilities curve, including how to calculate opportunity cost and graph curves by using a table or calculation. Learners use a variety of methods, including videos,...
Curated OER
Just Graph It!
Young scholars research presidential election voting results, and organize and interpret data on class graphs.
Curated OER
Math & Social Science
Learners are given data and are to calculate averages and yearly totals of how many cars travel the Tacoma Narrows Bridge. They also make a graph of the data.
Curated OER
Lesson Plan: The Net Neutrality Debate
Should Internet users who send data-heavy content pay higher fees than those who are involved in activities, like sending an email, that have less content? This question is at the heart of the Net Neutrality debate. After watching a PBS...
Curated OER
WORLD POPULATION STUDY
Students explore an exponential relationship and how it relates to human population growth and the current global population crisis.
Curated OER
Basic Needs and Economic Sharing
Students explain that some foods must be imported and some foods are exported from where they live. They also informally define economic sharing and explain why it is important.
National Council of Teachers of Mathematics
National Debt and Wars
Take a functional approach to the national debt. Learners collect information about the national debt by decade and plot the data. They determine whether an exponential curve is a good fit for the data by comparing the percent changes...


