Curated OER
Texting and Grades II
Given the least squares regression line, interpret the slope and intercept in the context of the relationship between texting and GPA. Although this task is short and looks simple, some subtle points can be brought to light in a...
Curated OER
Vocab-u-lous! Build a Fabulous Vocab
In this vocabulary worksheet, students decipher the best word choice to complete the sentence. All words begin with the letter "E."
Curated OER
Vocabulary Multiple Choice Worksheet 16
For this ESL vocabulary multiple choice worksheet, learners read 8 sentences that have a missing word. From 4 choices, students fill in the word that best completes each sentence.
Curated OER
Vocab-u-lous! Build a Fabulous Vocab: Words Beginning with O
In this vocabulary worksheet, students select the best word to complete the sentence. They are challenged by the difficult words that begin with "o."
Inside Mathematics
Scatter Diagram
It is positive that how one performs on the first test relates to their performance on the second test. The three-question assessment has class members read and analyze a scatter plot of test scores. They must determine whether...
Statistics Education Web
The United States of Obesity
Mississippi has both the highest obesity and poverty rate in the US. Does the rest of the data show a correlation between the poverty and obesity rate in a state? Learners tackle this question as they practice their skills of regression....
Center of Excellence for Science and Mathematics Education
A Sick Astronaut
Aspiring astronauts graph, interpret, and analyze data. They investigate the relationship between two variables in a problem situation. Using both graphic and symbolic representations they will grasp the concept of line of best fit to...
Creative Chemistry
A Simple Thermoetric Titration
In this thermometric titration activity, learners investigate the temperature changes when an acid neutralizes an alkali. High schoolers graph their results from the titration and draw the two best-fit lines on their graph. Where the...
Curated OER
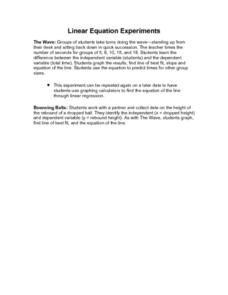
Linear Equation Experiments
In this linear equation learning exercise, students solve and complete 2 different experiments that include using linear equations. First, they determine the difference between independent and dependent variables. Then, students graph...
Curated OER
Be ready for your English exam
In this reading worksheet, students read each line and at the end of the line they write "correct" if the line is correct and if there is a word that should not be there, they write that word. Students complete this for 15 lines and then...
Curated OER
Homonyms Worksheet 1
For this grammar worksheet, students underline the appropriate word in parentheses that best fits twenty-one sentences. Students check to make sure each sentence is grammatically correct.
Curated OER
Strike a Pose: Modeling in the Real World (There's Nothing to It!)
Adjust this lesson to fit either beginning or more advanced learners. Build a scatter plot, determine appropriate model (linear, quadratic, exponential), and then extend to evaluate the model with residuals. This problem uses real-world...
Curated OER
SAT Problem Solving Practice Test
In this problem solving practice test, students select the best answer from 4 choices to ten questions. Questions are word problems and cover a variety of topics.
EngageNY
End-of-Module Assessment Task: Grade 8 Module 6
Test your knowledge of linear functions and models. The last installment of a 16-part module is an end-of-module assessment task. Pupils solve multi-part problems on bivariate data based on real-world situations to review concepts from...
Noyce Foundation
Through the Grapevine
Teach statistics by analyzing raisins. A thorough activity provides lesson resources for five levels to include all grades. Younger pupils work on counting and estimation, mid-level learners build on their understanding of the measures...
University of Utah
Statistics-Investigate Patterns of Association in Bivariate Data
Young mathematicians construct and analyze patterns of association in bivariate data using scatter plots and linear models. The sixth chapter of a 10-part eighth grade workbook series then prompts class members to construct and...
Curated OER
Linear Systems: Least Squares Approximations
In this least squares approximation worksheet, students use linear algebra to find the least square error and the equation of a line for given points. They find the equation of a parabola through provided points. This four-page...
Curated OER
Commercial Salmon Fishing
Students work with data about commercial fishing ofsalmon in Alaska. Students gather data, graph it, and analyze it.
Curated OER
Numerical Analysis: Introduction to Approximation Theory
In this introduction to approximation theory, students compute the slope and intercept of a line. They describe nonlinear relationships. This four page worksheet contains approximately five problems.
Curated OER
The Main Idea
In this writing paragraphs worksheet, students review the importance of a clear main idea within a paragraph. Students practice defining a clear main idea by using the ideas in the idea box and matching them with the list of points and...
Curated OER
Modelling Periodic Phenomena
In this Pre-calculus/Trigonometry instructional activity, students determine the trigonometric function that best models the given data. The eight page instructional activity contains explanation, examples, and twenty-one problems....
Curated OER
Notorious Confusables
In this similar words worksheet, students complete a 10 question multiple choice on-line interactive quiz about words that are easily confused. Students choose the best word to complete each sentence from 2 similar words. Example:...
Curated OER
Statistics
In this statistics learning exercise, students solve 2 problems that involving plotting data, recognizing ordered pairs, and analyzing the graphed relationship.
Curated OER
Statistics
In this statistics instructional activity, students view 6 graphs to determine the correlation. Students then answer 4 questions that involve plotting data, determining a relationship, and making predictions.
Other popular searches
- Line of Best Fit
- Best Fit Lines
- Lines of Best Fit
- Best Fitting Line
- Math Best Fit Line
- Algebra Line of Best Fit
- Best Fit Line Worksheets
- Correlation Best Fit Lines


