Kenan Fellows
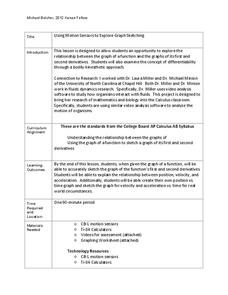
Using Motion Sensors to Explore Graph Sketching
Get moving to a better understanding of graphs of derivatives. Using motion sensors, scholars vary their velocities to create graphs of the first derivative of a function. The activity challenges groups to first create a script of the...
Curated OER
Molecular Biology and Primate Phylogenics
By counting differences in amino acids, biology stars examine the relationships between different primates. With information gleaned, they map out a phylogenic tree and discover common ancestry. You will need to create printable versions...
Curated OER
Molecular Biology and Primate Phylogenetics
Pairs of high school biologists compare amino acid differences in the beta hemoglobin of different primates. They use the information collected to construct a phylogenic tree. Follow-up discussion questions are provided. This is a...
Illustrative Mathematics
Logistic Growth Model, Abstract Version
Here learners get to flex some serious algebraic muscles through an investigation of logistic growth. The properties of the constant terms in the logistic growth formula are unraveled in a short but content-dense activity. Moving...
Teach Engineering
Complex Networks and Graphs
Show your class how engineers use graphs to understand large and complex systems. The resource provides the beginnings of graph theory by introducing the class to set theory, graphs, and degree distributions of a graph.
Curated OER
Lab Experiments in Nutrition Activity
Which vitamins should be ingested daily for maximum nutrition? Learners with ispecial needs or those who are pregnant focused on television and magazines advertisements that are used to sell food products. They conduct experiments and...
Serendip
Changing Biological Communities – Disturbance and Succession
After cutting down a forest to make a farm, how long would it take the environment to turn an abandoned farm back into a forest? Scholars study this exact scenario while they interpret many charts and graphs of the changing ecosystems as...
Curated OER
Biological and Agricultural Engineering
Eighth graders explore mathematics by conducting a series of investigations using a colorimeter. In this math lesson, 8th graders explain the purpose of food irradiation. They collect data and graph them.
Mascil Project
Epidemics: Modelling with Mathematics
The Black Death epidemic is responsible for more than one million deaths in the United Kingdom. An inquiry-based activity has young scholars explore the rate of disease spread. They then analyze graphs showing data from epidemics such as...
Kenan Fellows
Man vs. Beast: Approximating Derivatives using Human and Animal Movement
What does dropping a ball look like as a graph? An engaging activity asks learners to record a video of dropping a ball and uploading the video to software for analysis. They compare the position of the ball to time and calculate the...
Curated OER
Graphing in an Experimental Context
Seventh graders discuss the importance of being able to represent scientific data in the form of graphs. They comprehend the differences between a bar graph and a line graph. Students identify the type of data with which each graph...
Virginia Department of Education
Prokaryotes
Lead your biology class on a cell-sized adventure! Emerging scientists construct models of prokaryotes, then design an experiment to properly grow a bacterial culture. They conclude the activity by viewing the culture under a microscope....
Curated OER
Who Lives in the Water? Stream Side Science
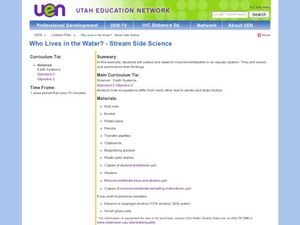
Andree Walker thought of everything when he wrote this resource. It includes a detailed list of materials and background information links for the teacher. In addition, it has procedures, a macroinvertebrate identification key, and tally...
Curated OER
Graphing And Data Presentation
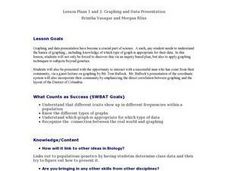
Students engage in a study of science and mathematics with the practice of creating graphs. A guest speaker comes to the class to share statistics from the community and the students are shown how he uses the coordinate system in the...
Curated OER
Graphing Iron Data
Learners apply a data set to create a graph show how iron ore impacts an ecosystem. They explain how the iron effects the distribution and abundance of phytoplankton in coastal ecosystems using spreadsheet software.
Virginia Department of Education
Greenhouse Gas Modeling Activity
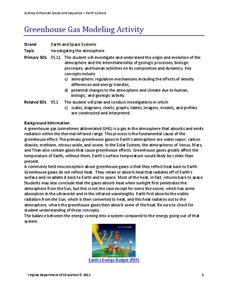
Why are greenhouse gases called greenhouse gases? Young Earth scientists learn about greenhouse gases though experimentation in the second installment of a 3-part series. They use lamps to model radiant energy as well as warming through...
Virginia Department of Education
DNA Structure, Nucleic Acids, and Proteins
What is in that double helix? Explain intricate concepts with a variety of creative activities in a lesson that incorporates multiple steps to cover DNA structure, nucleic acids, and proteins. Pupils explore the history of DNA structure,...
Curated OER
How do Hypotonic, Hypertonic, and Isotonic Solutions Affect the Water Movement of a Cell?
After removing the shell from a raw egg, cell biologists soak the egg in either a hypotonic, hypertonic, or isotonic corn syrup solution. They calculate the percent change in mass and compare it to the strength of the solution in a...
Curated OER
Wetland vs. Stream Macroinvertebrates
A link to a comprehensive macroinvertebrate guide gives you the information needed to prepare for this field study activity. Sample macroinvertebrates are collected from areas representing different environmental conditions. Junior...
Curated OER
Scientific Graphs
Students organize data collected from their experiments using graphs. In this statistics and biology lesson, students organize their scientific data from an article into readable graphs. They define the usefulness of their graph and...
Curated OER
Primary Biological Content Area Covered
Students use the scientific method to make predictions about mold growth. In this fungus lesson, students use worksheets to help them illustrate predictions and graph mold growth from white to wheat bread. Students first...
Curated OER
Biological Succession in a Microecosystem
High schoolers investigate the concept of biological succession by simulating the process in a microenvironment with various microorganisms. By engaging in a lab, students determine the factors causing succession and learn population...
University of Rhode Island
How Does the Human Body Use Energy during Various Athletic Activities?
Students investigate how much energy is used during different athletic activities. They conduct Internet research to obtain information on the top three athletic sporting events from around the world, and calculate the calories burned...
Curated OER
The Great Pollinators
Students discover the reproductive parts of a plant. In this biology lesson, students identify and categorize several different plants they dissect in class. Students record their information using a data chart.


