US Department of Commerce
Commuting to Work: Box Plots, Central Tendency, Outliers
Biking may be an outlier. Using data from 10 states on the number of people reporting they bike to work, pupils calculate the measures of center. Scholars determine the range and interquartile range and find which provides a better...
US Department of Commerce
Does the Percentage of People Who Walk to Work in Cities Vary with Population Size?
To walk or not to walk? Pupils create box plots comparing the percentage of residents who walk to work in large, medium, and small cities. Using the box plots, class members compare the data that reflects available statistics. Scholars...
Greater Grace Christian Academy
Cereal Box Book Report
Need a creative idea for an elementary book report? Use a cereal box project to engage your readers beyond plot, setting, and characters. The lesson includes templates for the project and examples from Charlie and the Chocolate...
Centre for Innovation in Mathematics Teaching
Ten Data Analysis Activities
This thirteen page data analysis learning exercise contains a number of interesting problems regarding statistics. The activities cover the concepts of average measurements, standard deviation, box and whisker plots, quartiles, frequency...
US Department of Commerce
How Are Single-Parent Households Distributed Across the United States?
There sure are a lot of single-parent households in the country. After selecting one of four US regions to investigate, pupils create dot plots and box plots on the percentage of single-parent households with male parents and female...
Illustrative Mathematics
Puzzle Times
Give your mathematicians this set of data and have them create a dot plot, then find mean and median. They are asked to question the values of the mean and median and decide why they are not equal. Have learners write their answers or...
Curated OER
Button Bonanza
Collections of data represented in stem and leaf plots are organized by young statisticians as they embark some math engaging activities.
Teach Engineering
Build the Biggest Box
Boxing takes on a whole new meaning! The second installment of the three-part series has groups create lidless boxes from construction paper that can hold the most rice. After testing out their constructions, they build a new box....
Illustrative Mathematics
Puppy Weights
Nobody can say no to puppies, so lets use them in math! Your learners will take puppy birth weights and organize them into different graphs. They can do a variety of different graphs and detail into the problem based on your classroom...
Prestwick House
Wuthering Heights
How many ways can you break down a classic novel? Based on the acclaimed Romantic-period novel by Emily Bronte, the Wuthering Heights activity pack includes a pre-reading exercise. Next, learners create a resume for one of the...
Perfection Learning
I Know Why the Caged Bird Sings
A revolutionary work of literature requires a revolutionary assessment project. A series of activities on Maya Angelou's I Know Why the Caged Bird Sings includes discussion questions, a plot synopsis, and a selection of both short...
Illustrative Mathematics
Speed Trap
In which direction is traffic moving faster, north or south? Use box and whisker plots to organize data and interpret the results. Detailed solutions are included. This activity would be good as a warm up or quick assessment at the...
Illustrative Mathematics
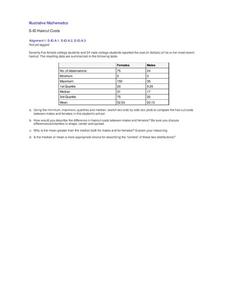
Haircut Costs
Who pays more for haircuts, men or women? Given quartile values, learners construct box and whiskers plots and interpret the results. They compare the mean and median, and discuss which is more appropriate under particular conditions....
Prestwick House
Fahrenheit 451—Activity Pack
The burning questions is at what point do readers of Fahrenheit 451 recognize the many literary devices Ray Bradbury employs in his dystopian classic that warns of a society that uses media to indoctrinate the public and denigrates...
Fort Bend Independent School District
Data Analysis - AP Statistics
What better way to study survey design than to design your own survey! Bring a versatile data analysis project to your AP Statistics class, and encourage them to apply the practices from their instructions to a real-world survey...
Ideas From Suzi
Guided Reading: Beyond the Basics
Elevate children's reading comprehension skills with this collection of guided reading resources. From paper dice with basic comprehension questions printed on them to a system for using sticky notes to identify key...
National Council of Teachers of Mathematics
Eruptions: Old Faithful Geyser
How long do we have to wait? Given several days of times between eruptions of Old Faithful, learners create a graphical representation for two days. Groups combine their data to determine an appropriate wait time between eruptions.
Curated OER
Geometry Project
Proofs are usually an intimidating assignment. An engaging lesson focused on geometric proofs may reduce the anxiety! Pupils choose between several triangle proofs to complete and work on completing them. The...
Curated OER
Point Reflection
Use this task as an exit ticket for your eight graders during the geometry unit. All they need to do is identify the coordinates of a point reflected over y=2000.
Prestwick House
The Grapes of Wrath
At over 450 pages, John Steinbeck's Pulitzer Prize winning novel The Grapes of Wrath can be a challenging choice for full-class, book circle, or independent reading. The activities in a 10-page sample The Grapes of Wrath...
Texas Instruments
Texas Instruments: Box Plots: How Many Pairs of Socks
The purpose of this lesson is to help students use the shape of a line plot to interpret the shape of a box plot.
Shodor Education Foundation
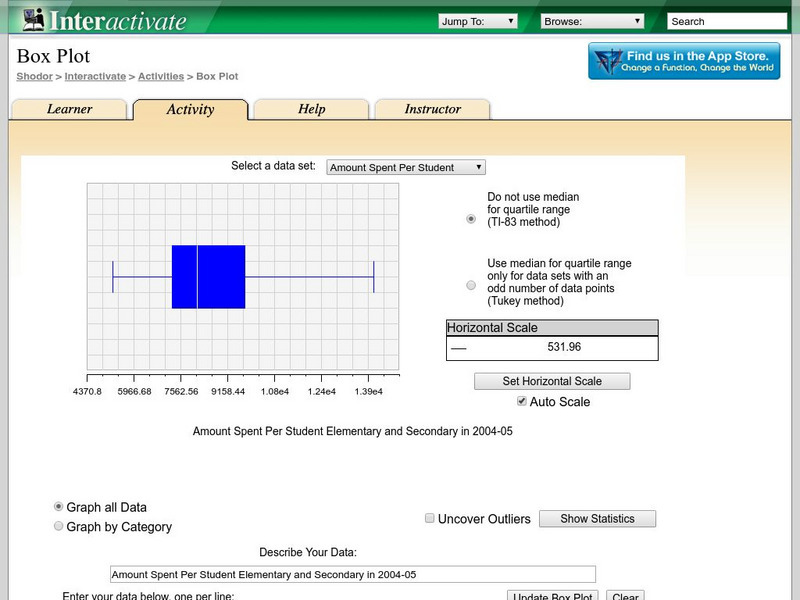
Shodor Interactivate: Box Plot
Students learn about box-and-whisker plots. The interactive box plot allows the user to explore maximum, minimum, median, upper quartile, lower quartile, and outliers.
National Council of Teachers of Mathematics
Nctm: Illuminations: Box Plotter
Use this applet to create a customized box plot with your own data, or display a box plot of an included set of data.
Texas Instruments
Texas Instruments: How Tall? Describing Data With Statistical Plots
In this activity, students' will measure their heights using a motion detector and describe the data using the statistical concept called box plot.
Other popular searches
- Analyzing Box Plots
- Outliers Box Plots
- Interpret Box Plots
- Graphs Box Plots
- Analysing Box Plots
- Leaf Box Plots
- Statistics Box Plots
- Conclude Box Plots
- Box Plots Worksheets
- Double Box and Whisker Plots
- Scatterplot Box


