Curated OER
Currency Exchange Rates
Students, in groups, choose three countries from which to investigate exchange rates versus the US dollar. Using Internet research they follow daily exchange rates and compute the percentage change. They compile data and prepare and...
Mathematics Assessment Project
T-Shirt Sale
Everyone loves a sale! As pupils investigate a sale on t-shirts, they determine the percent discount and original prices.
Curated OER
Play Ball
Students calculate baseball statistics and ball field dimensions. In this Pythagorean Theorem, percentages and metric conversion lesson, students are given formulas to find earned run and batting averages for White Sox baseball players....
Curated OER
The Great Depression: What Would it be like today?
Students calculate the percentage decline in factors affecting the quality of life such as wages and unemployment, from before the Depression to the beginning of the New Deal. Students then calculate what the same percentage decline for...
Curated OER
Scaling Down Art
Students change the scale of a work of art using ratios, percentages, and proportions. While this is technically an art lesson, there is quite a bit of mathematics involved in converting to the correct scale.
Curated OER
Baseball Relationships - Using Scatter Plots
Students use graphing calculators to create scatter plots of given baseball data. They also determine percentages and ratios, slope, y-intercepts, etc. all using baseball data and statistics.
Curated OER
"Water is Life" Global Water Awareness
Students examine and calculate the percentage of potable water remaining on the earth. In this ecology and geography lesson, students brainstorm the main factors affecting water distribution. Students use mathematical problem solving to...
Curated OER
Seeing a Dwarf Planet Clearly: Pluto
In this dwarf planet learning exercise, students use images from the Hubble Space Telescope and they determine the scale of the image, they identify the largest features in the images, they calculate the volume of Pluto and they create a...
Curated OER
Probability and Geometry
Students examine the relationship between probability and geometry to solve problems. In this geometry and probability lesson, students investigate the effect of changing percentages on a spinner to the probability of landing on a...
Curated OER
Finding the Percent of a Number
In this mathematics worksheet, 6th graders find the percents of various numbers. They set up the problem, estimate, and write their response. Students also compare their answers to their estimates for each problem.
Curated OER
Monitoring Oxygen Level
Students measure oxygen percentages in room air and air exhaled after they perform various activities. They explore various websites, and record and analyze the data from the experiments.
Curated OER
Measuring Supporting Structures
Students calculate the volume of the Pantheon's columns and estimate changes in weight given different parameters.
Curated OER
Ocean Water
Given data about the composition of ocean water, students complete 5 different questions using a provded table that relate to the ocean water (with elements Chloride, Sodium, Sulfate, and Magnesium). Some questions require calculation,...
Curated OER
What are the Chances: A Game of Chance!
Sixth graders experiment with dice, playing cards, pennies and computer-generated simulations to calculate probability. They use compiled data to make predictions.
Curated OER
Z-Scores
Young scholars solve problems by identifying the percent of area under the curve. In this statistics lesson, students discuss z-scores as they calculate the different percentages under the bell curve. They calculate the standard deviation.
Curated OER
Mixture Problems
Ninth graders explore the concept of mixture problems. In this mixture problem lesson plan, 9th graders use beads to resemble liquids. Students mix different amounts of beads to create different percentages of mixtures.
Curated OER
Chromosomes
Students study chromosomes and how molecular half life affects them. For this chromosome lesson students complete several lab activities on calculating half life, and cracking alkanes.
Curated OER
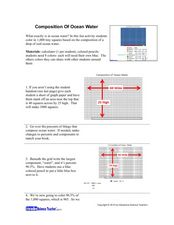
Composition of Ocean Water
Students experiment to determine the composition of ocean water. In this ocean water composition lesson, students color in a grid that shows the percentage of each of the components of ocean water which include chloride, sodium, sulfate,...
Curated OER
Bubble Gum Chemistry
Students explore the concept of graphing data. In this graphing data lesson, students determine the percentage of sugar in bubble gum. Students graph type of gum vs. sugar percentage. Students create a table of their data.
Curated OER
Voter Turnout
Students solve problems using math. They complete a graph, using data from the 2000 presidential election results. Students predict and calculate the outcome of the election based upon the voting patterns.
Curated OER
State Assisted Capitalism
Middle schoolers discuss a the places to gain financial help when starting a business. With a partner, they calculate the amount of interest and the total amount being paid back. they brainstorm a list of things the government can do...
Curated OER
Habitat Is Home
Students are introduced to the concept and components of a habitat. They discuss the key components of a habitat and describe how certain factors can cause disturbances in a habitat and change its population. Activities are leveled for...
Curated OER
Different Perspectives of Oregon's Forest Economic Geography
Students locate the many forests located in Oregon. In groups, they use the internet to research employment data on wood products made in the state. They discuss how looking at information presented in a different way can change their...
Curated OER
Decimals in the Garden
In this math worksheet, students are given pictures of garden tools and prices (in pounds). They select the items they would like to purchase for their garden and calculate the cost to buy these items. Students may use the internet to...


