Curated OER
Graph Both Crusts
Fourth graders calculate the angles and construct a pie graph of the percentages of the elements in the continental and oceanic crusts. Then they analyze the results. They can be assigned the task of researching the percentages.
Curated OER
Dino Long Legs
Students calculate the stride length of a walking or running animal. They use scale models of dinosaurs to calculate the leg and stride length of the animals.
Curated OER
Chances Are: Talking Probability
Students explore probability and the process of data analysis and predictions. They participate in two activities, one involving a calculator and one the Internet, in which they make predictions and conduct activities to test their...
Curated OER
Spreadsheets - WP9/Quattro Pro
Learners discover spreadsheet applications using Quattro Pro. They demonstrate basic knowledge and application of hardware, software, and Internet use. They recognize and appreciate the value of recording keeping, data input and data...
Curated OER
Measuring the Sun's Diameter
Students project and measure the suns image using a refracting telescope. In this sun's diameter instructional activity students calculate the magnification of the telescope and determine the diameter if the Sun.
Curated OER
Measuring The Earth
Students use their geometry and trigonometry skills to determine the distance between their school and another school.
Curated OER
Balanced Students
Students investigate the relationships between weights, and construct a balanced first class lever. They formulate a general equation for the relationship explored in the experiment and perform calculations.
Curated OER
Looking Back in Time (Alternative Activity)
Students, in groups, devise alternative ways of measuring distances. They view a video and are introduced to the concept of parallax in measuring. They discuss their ideas with the class.
Curated OER
Tallahassee Project
Sixth graders gather information from technological sources such as TV, radio, and Internet as well as from newspapers and maps and produce a final printed report. They use the data to create a spreadsheet and read a Florida state...
Curated OER
Hit Me With Your Best Shot
Sixth graders discuss the effect of gravity on objects. In groups, they participate in different activities in which they observe the effect of motion on objects and how energy is transferred between objects. To end the lesson, they...
Curated OER
Fly Away With Averages
Learners discover the process of finding the mean, median, and mode. Through guided practice and problem solving activities, they use a computer program to input data and create a graph. Graph data is used to calculate the mean,...
Curated OER
Rolling Spheres on Inclined Planes
Students determine the distance of a sphere rolling down an incline. In this physics lesson students participate in a lab that demonstrates how inclined planes make work easier.
Curated OER
The Slave Trade
Students map and explore a possible slave trade route. For this slave trade mapping lesson, students calculate the distance and amount of time it would take for African slaves to arrive in America.
Curated OER
Parabolas in Flight
Students utilize a trajectory formula in order to discover the physics of a thrown ball. In this physics lesson, students videotape the trajectory of a thrown ball or basketball shot and analyze the action by breaking the video down...
Curated OER
Potato Launcher Energy Lab
Students investigate conservation laws using a potato launcher. In this physics lesson, students measure angles, time and distance of the potato. They discuss applications of experiments like this.
Curated OER
Guess the Card -Probability
This site is used for distance education purposes and professional development of teachers
Curated OER
Magic Mountain Coaster Computation
Students use the Internet to do research on the roller coasters at Magic Mountain Amusement Park. They must use mathematical formulas to calculate the highest and fastest coaster at the park.
Curated OER
Golden Ratio of the Human Body
High schoolers calculate the ratio of the height of the body to the height of the navel. They discover that the ratios are all approximately equal.
Curated OER
ndirect Measurement Technique: Using Trigonometric Ratios
Ninth graders find the height of an object that would be difficult or impossible to measure directly. They construct and use a Clinometer to measure the angle of elevation (or depression). Students create a sketch of the measurement...
Curated OER
Minimize Perimeter
Students practice calculating the perimeter of different sized rectangles. Individually, they identify the derivations of a function that can show the perimeter and determine how to minimize the perimeter within a fixed area. They use...
Curated OER
Minimize Perimeter -- Lecture
Pupils are introduced to the concept of perimeter. As a class, they listen to a lecture describing the derivations of a function that describes perimeter. They calculate the minimum perimeter of a rectangle and determine the numbers...
Curated OER
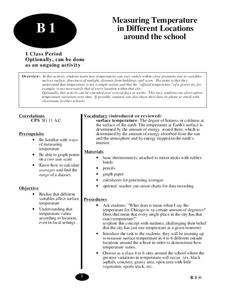
Measuring Temperature
Students explore the different variables that affect surface temperature. They study how temperatures can vary widely within close proximity due to variables such as surface, directness of sunlight, and distance from buildings.
Curated OER
Univariate Data Analysis
Students use given data to compare baseball players. They create box and whisker plots to compare the players and determine which they feel is the best player. Students use calculators to make box and whisker plots. They write paragraphs...


