Curated OER
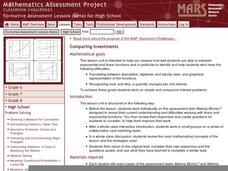
Comparing Investments
Money, money, money. A complete lesson that makes use of different representations of simple and compound interest, including written scenarios, tables, graphs, and equations to highlight similarities and differences between linear and...
Curated OER
The Million $ Mission
Students study exponential growth. The lesson is designed for students to work independently, or in groups with guidance from the teacher.
Curated OER
Millions, Billions, Trillions
Students use real-world data to compare the relative sizes of millions and billions, and exponential growth. They use the salaries of famous people such as, Michael Jordan and Bill Gates to understand this math concept.
Curated OER
An Introduction to Functions
Students investigate the growth and decay of an exponential function. In this algebra activity, students apply properties of exponent solve problems. They identify any patterns they see in the graphs.
Curated OER
The Dynamics of Populations
Tenth graders analyze the growth rate of different population. In this biology experiment, 10th graders identify the biotic and abiotic factors that limit population size. They create a poster to show their findings in class.
Curated OER
Worksheet #6, Exponents, Interest, and Radioactive Decay of Isotopes
For this calculus worksheet, students sketch graphs of given exponential functions. They compute the principal needed to have a given ending balance when the interest is compounded at varying times. Students use a simple exponential...
EngageNY
Percent Rate of Change
If mathematicians know the secret to compound interest, why aren't more of them rich? Young mathematicians explore compound interest with exponential functions in the twenty-seventh installment of a 35-part module. They calculate future...
Curated OER
Modeling: Having Kittens
Cats can't add, but they do multiply! Determine the number of descendants of a single cat given specific facts about cats and kittens. The lesson focuses on developing strategies for problem solving using both individual and group work....
Curated OER
World Population Study
Learners explore an exponential relationship and how it relates to human population growth and the current global population crisis. They graph both exponential and linear information.
Curated OER
WORLD POPULATION STUDY
Students explore an exponential relationship and how it relates to human population growth and the current global population crisis.
Curated OER
How Much Data is That?
Students differentiate between exponential and logarithmic functions. In this algebra instructional activity, students use logarithmic properties to solve equations. They identify growth and decay of graphs.
Curated OER
Graphing the Population Explosion of Weeds
Students are introduced to the seed cycle and draw the specific steps. In groups, they identify the human barriers to the spreading of weeds. After calculating the rate of spreading of the Yellowstar Thistle, they create graphs to see a...
Curated OER
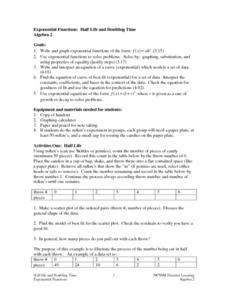
Exponential Functions: Half Life and Doubling Time
Students investigate the concept of exponential functions and how they increase in size over time. They simplify the functions in order to find the solutions that are possible and perform analysis of the curved line that is produced when...
Curated OER
Count The Letters
Students perform activities involving ratios, proportions and percents. Given a newspaper article, groups of students count the number of letters in a given area. They use calculators and data collected to construct a pie chart and bar...
Curated OER
Means of Growth
Students collect and graph data. In this statistics lesson, students analyze their plotted data using a scatter plot. They identify lines as having positive, negative or no correlation.
Curated OER
Populations Lab - Exponential Graphing
Ninth graders investigate the application of populations that exists in one's everyday environment, in order to develop an understanding of how mathematics is a key component in the understanding of population dynamics.
Curated OER
Oodles of Poodles
Students solve equations by graphing. In this algebra lesson, students differentiate between functions and relations. They use the TI to graph their equation and analyze the graph.
Curated OER
Spreading Doom
Students explore the pattern created by a sequence or series. In this geometry lesson, students relate the spread of a virus to the growth of exponential functions. They collect data as they analyze the sequence created by the growth.
Curated OER
Graphing Functions
In this graphing functions worksheet, students write functions in logarithmic and exponential forms. They evaluate logarithms and determine the inverse of a function. Students graph functions. This six-page worksheet...
Curated OER
Species Interactions
Students study the scientific concepts of biodiversity and conservation through the use of basic equations of population growth and hands-on experiments/simulations. The lesson includes a take-home assignment which can be used for final...
Curated OER
Risky Business
Students view a video on AIDS, HIV and the ways in which HIV is spread. They discuss ways to avoid contracting HIV and participate in a simulation that shows the growth of a communicable disease.
Curated OER
Save Your Change
Students solve problems involving exponential, logarithmic, and scientific notations. Using calculators, students explore investment problems. They use a formula and logarithms to determine the years to earn a particular income, figure...
Google
The Law of Large Numbers and Probability
Learners investigate why theoretical probability doesn't always match reality. The activity involves using Python 2.7 (or Sage) to set up a Bernoulli Trial. It also involves setting up a spreadsheet to simulate the Birthday Paradox....
Population Connection
The Peopling of Our Planet
How many people live on the planet, anyway? The first resource in a six-part series covers the topic of the world population. Scholars work in groups to conduct research and make population posters after learning about the global...
